How Can You Tell There Are Russian Troops in Syria? Just Look for Some Soldier Selfies

Although Russian President Vladimir Putin has denied that he is sending troops to Syria, selfies taken by Russian soldiers and posted on social media are telling a different story.
Russian investigative journalist Ruslan Leviev reports that an increasing number of experienced Russian troops have been deployed to a naval maintenance facility in Tartus, along Syria’s Mediterranean coast. His source? Status updates and photos posted on Russia’s two biggest social networking sites by members of the 810th marine brigade, an infantry force in the Russian navy.
Related: As Putin Targets Dissent, U.S. Democracy Group Banned in Russia
One photo Leviev found is of a career soldier named Mazhnikov, who appears to be at the naval facility in Syria. Another soldier, Anatoly Golota, also a member of the 810th brigade, updated his status on the Russian version of Facebook with the words, “Off to Syria :)).”
Russia has not denied that it’s been supplying weapons to the Syrian government and helping train the Syrian military. But Putin knows that combat troops are a different story.
The naval maintenance facility at Tartus is small, and in the past has been manned by just a handful of personnel. Leviev reports that the number of troops stationed at the facility is growing, and the troops are experienced contract soldiers, not draftees.
Videos uploaded to social media sites have raised concerns that Russian troops might be involved in combat inside Syria, according to an article in Foreign Policy. However, beyond the footage, which shows a Russian-made BTR-82A armored vehicle firing its gun in Syria, no other substantial evidence of active combat involving Russian troops has been found.
While the marines may or may not be directly involved in the fighting, the presence of Russian troops in Syria shows how hard Putin is pressing for a victory by the Assad regime. Now if he can just teach his soldiers how to avoid giving themselves away on social media.
Top Reads From The Fiscal Times
- Putin’s Economy May Be in Even Worse Shape Than It Looks
- China Sends a Message with Its New ‘Carrier Killer Missile
- In Showing Off Physical Strength, Putin Tries to Hide Political Weaknesses
Chart of the Day: Boosting Corporate Tax Revenues
The leading candidates for the Democratic presidential nomination have all proposed increasing taxes on corporations, including raising income tax rates to levels ranging from 25% to 35%, up from the current 21% imposed by the Republican tax cuts in 2017. With Bernie Sanders leading the way at $3.9 trillion, here’s how much revenue the higher proposed corporate taxes, along with additional proposed surtaxes and reduced tax breaks, would generate over a decade, according to calculations by the right-leaning Tax Foundation, highlighted Wednesday by Bloomberg News.
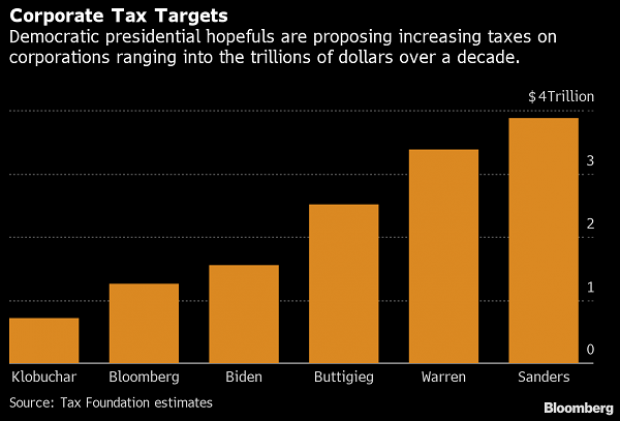
Chart of the Day: Discretionary Spending Droops
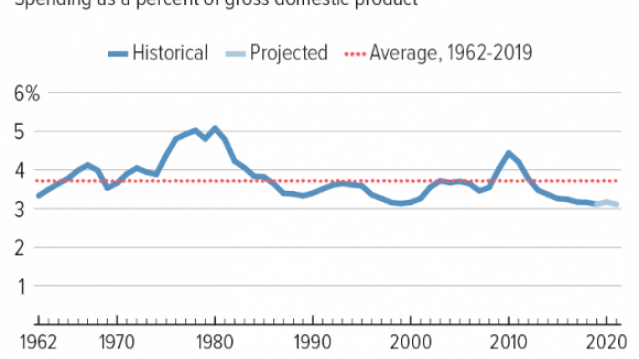
The federal government’s total non-defense discretionary spending – which covers everything from education and national parks to veterans’ medical care and low-income housing assistance – equals 3.2% of GDP in 2020, near historic lows going back to 1962, according to an analysis this week from the Center on Budget and Policy Priorities.
Chart of the Week: Trump Adds $4.7 Trillion in Debt
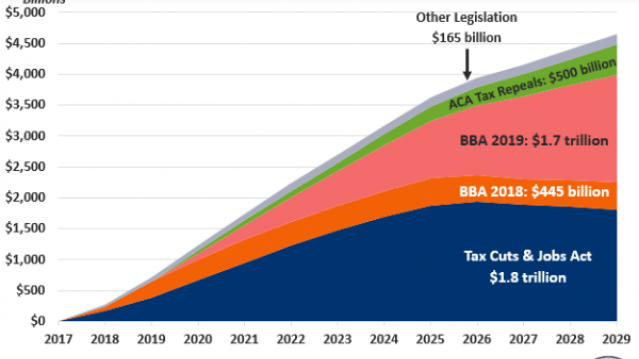
The Committee for a Responsible Federal Budget estimated this week that President Trump has now signed legislation that will add a total of $4.7 trillion to the national debt between 2017 and 2029. Tax cuts and spending increases account for similar portions of the projected increase, though if the individual tax cuts in the 2017 Republican overhaul are extended beyond their current expiration date at the end of 2025, they would add another $1 trillion in debt through 2029.
Chart of the Day: The Long Decline in Interest Rates

Are interest rates destined to move higher, increasing the cost of private and public debt? While many experts believe that higher rates are all but inevitable, historian Paul Schmelzing argues that today’s low-interest environment is consistent with a long-term trend stretching back 600 years.
The chart “shows a clear historical downtrend, with rates falling about 1% every 60 years to near zero today,” says Bloomberg’s Aaron Brown. “Rates do tend to revert to a mean, but that mean seems to be declining.”
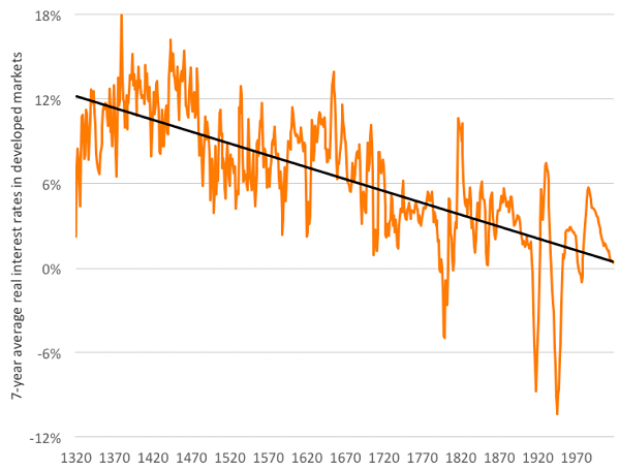
Chart of the Day: Drug Price Plans Compared

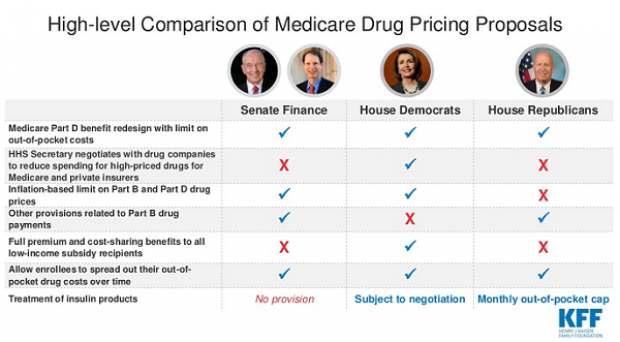
Lawmakers are considering three separate bills that are intended to reduce the cost of prescription drugs. Here’s an overview of the proposals, from a series of charts produced by the Kaiser Family Foundation this week. An interesting detail highlighted in another chart: 88% of voters – including 92% of Democrats and 85% of Republicans – want to give the government the power to negotiate prices with drug companies.
