
When it comes to your investments, you don’t need a degree in know where you stand and how to plan for your future. There are now dozens of online tools to help you dissect the information in a clear, understandable way – and some of them don't cost a dime. We picked three of the best free online tools to help you graduate from investment newbie to pro. XBRL Data in Use, Forcastix and Calcbench all use data from SEC filings to organize the information in interesting and accessible ways.
RELATED: 10 Bad Investments No Sane Person Should Make
1. XBRL Data
Let’s say you’re thinking about investing in a company that manufactures pharmaceuticals. Start by visiting XBRL Data in Use. You’ll notice the clickable pie chart in the center showing the breakdown of the U.S. economy. You can click on manufacturing and then on pharmaceuticals to get the overall picture, or if you look to the left, you’ll notice a few drop down task bars.
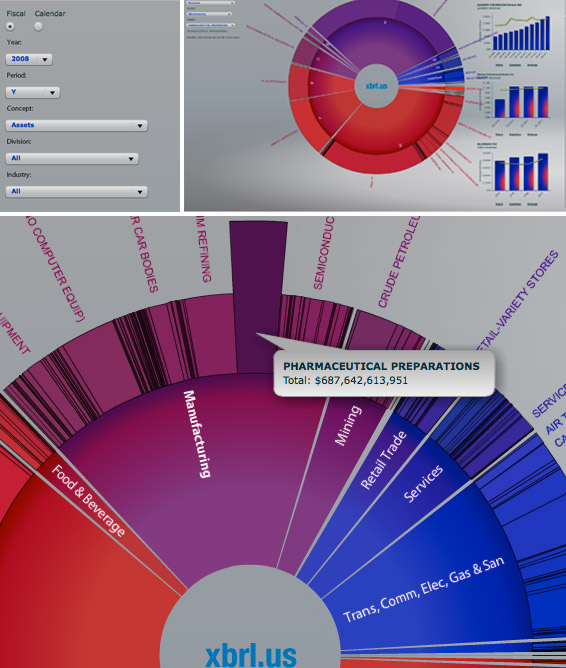
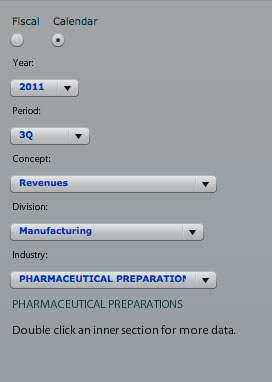
Click the calendar year button instead of fiscal year (each company may have a different standard for fiscal year reporting), and select the third quarter of 2011 since it's the last quarter with full data. Then from the concept bar, select revenue. Select manufacturing from the division dropdown and pharmaceutical preparations from the industry dropdown.
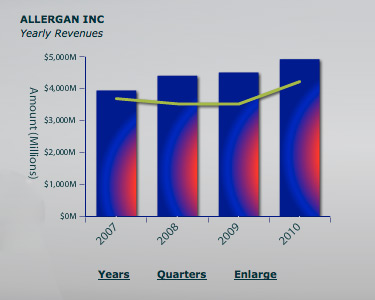
In the center of the screen, you’ll have a new chart with major pharmaceutical companies and their percentage of the industry's revenue. On the far right hand side are bar charts with each company’s last four full years of revenue with a green line that represents the industry weighted average. Let’s look at Allergan Inc. Scroll to Allergan and click years underneath the chart. Allergan (AGN) performs well year after year. To research a bit further, change your concept selection to Research & Development. What would any manufacturer be worth without developing new products? Now, a new chart appears comparing pharmaceutical companies based on Research & Development. If you look to the right AGN’s bar chart on Research & Development shows they’re consistently spending money in this area.
2. Forcastix
Now let’s see what we can find out using Forcastix, which launched last year.
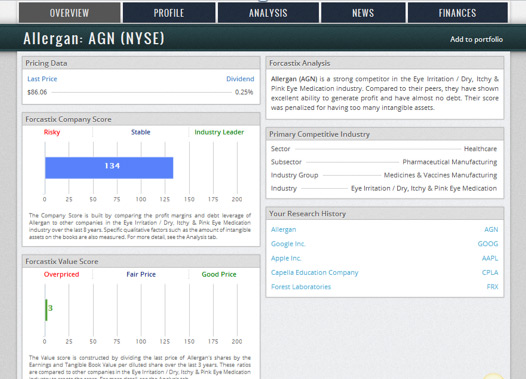
In the search box, type in the stock ticker AGN. Press enter. The top chart is the company score based on debt level/stability from the last eight years. AGN has a high score of 134, but the “Forcastix Value Score” in the bottom chart is low. Why? The current stock price is considered high compared to the last three years of profit per share. If you click on the Finances tab from the top menu bar, you’ll notice profit was significantly lower in 2010 than in 2009.
For more info on how Forcastix calculates company scores, check out this explainer.
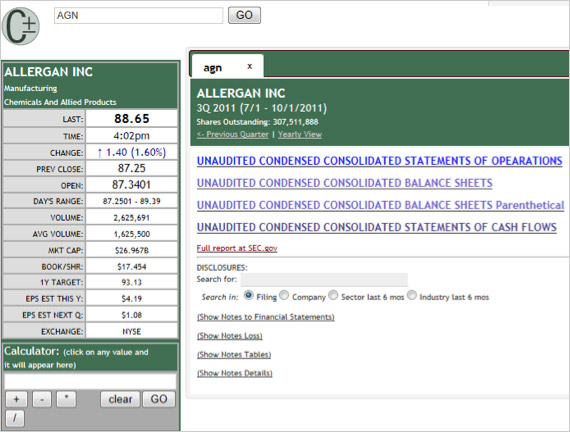
3. Calcbench
You can stop here or checkout Calcbench, which also launched in 2011, to see if there was a change in expenses effecting profits. Type in AGN into the text box and press enter. Then select yearly view. The first statement in the list is the Consolidated Statement of Earnings. Click on it. You'll see both revenue and expenses for three years. In 2010, there was a $609 million dollar legal settlement. Close the page by clicking on X in the upper right-hand corner. To learn a bit about the disclosure, click on show notes to financial statements. Then click on Disclosure legal proceedings.
Of course, as always with investing, don't use these tools as your only source for big decisions and always consult with a financial advisor. There could be additional industry news that could also impact your investment decisions – for example, a major drug that is going generic – and you don’t want to overlook anything. But the good news is, you’ll have important questions and great data to share next time you meet with your advisor.


