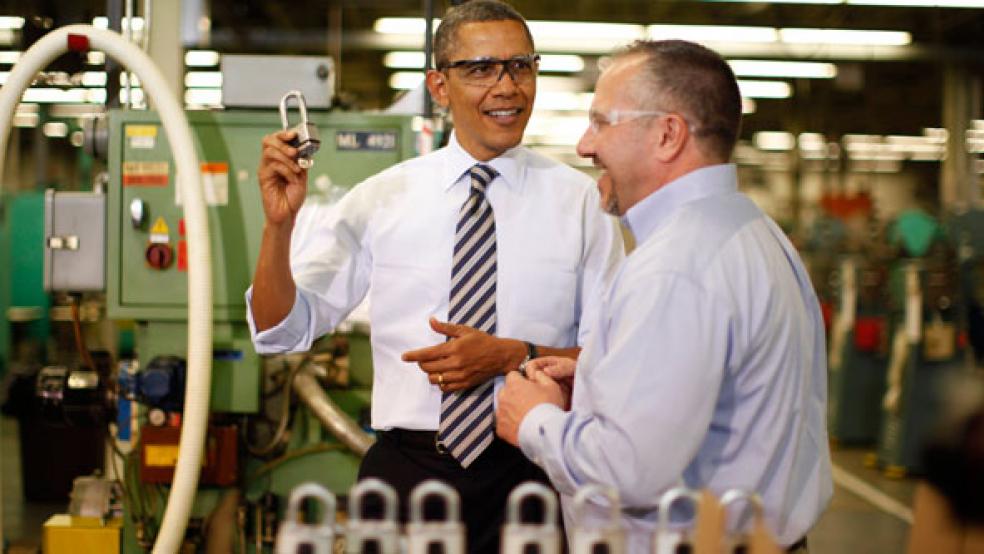
At a visit to the Master Lock company in Milwaukee yesterday, President Obama made a push for his plan to lure manufacturing jobs back to the U.S., and took the opportunity to tout the country’s improving employment picture. “Over the last 23 months, businesses have added nearly 3.7 million new jobs,” Obama said, “Manufacturing is coming back. Companies are starting to bring jobs back. The economy is getting stronger. The recovery is speeding up. We're moving in the right direction. And now we have to do everything in our power to keep our foot on the gas.”
But while the private-sector job growth has been gradually accelerating, government – whether federal, state or local – has been hitting the brakes. The private sector has added jobs in each of the last 23 months, while the government has shed jobs in 18 of the last 20. So while Obama talks about the 3.7 million jobs added since February 2010, federal, state and local governments have also slashed 500,000 jobs over that same time span.
Still, government accounts for a hefty portion of our overall workforce, and a new survey by Gallup helps illustrate that point. Overall, Gallup says 16.3 percent of workers – nearly one in six – were employed by the government last year, down from 17.2 percent in 2010. States accounted for the largest share of those workers, or 6.5 percent of workers overall, followed by 5.1 percent for local government and 4.4 percent for the feds (0.3 percent didn’t specify to Gallup the level at which they work).
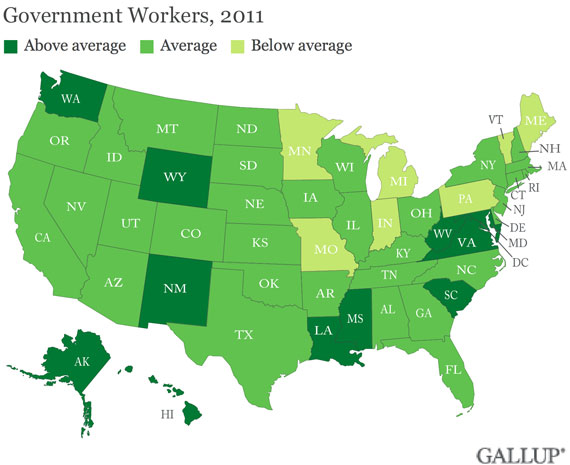
The government still employs more than one in nine workers in every single state. In eight states plus the District of Columbia, it accounts for more than one in five workers.
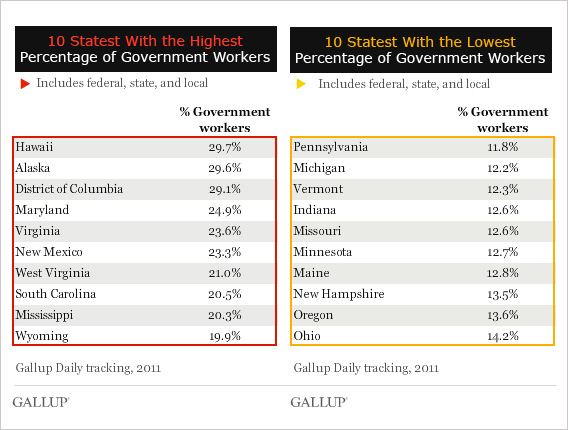
Not surprisingly, government accounts for 29.1 percent of employees in D.C. and nearly a quarter of workers in nearby Maryland and Virginia. But those proportions are topped by Hawaii and Alaska, where nearly three in 10 workers are on government payrolls. At the other end of the spectrum, industrial states Pennsylvania and Michigan have the lowest percentages of government workers.
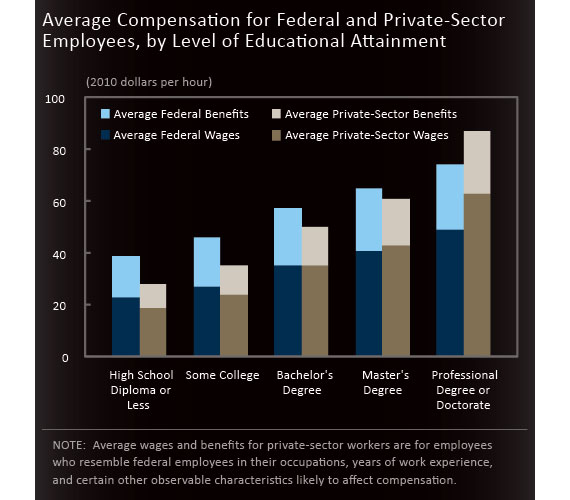
While government may be shrinking, federal employees at least have one reason to be happy. Compared with private-sector workers, federal employees from 2005 to 2010 got paid about 2 percent more, according to a Congressional Budget Office report issued last month – and 16 percent more when benefits including health insurance, retirement plans and paid vacation are factored in.
The differences in compensation get flipped, though, with advancing levels of education. Federal employees with no more than a high school education got compensated an average of 36 percent higher than their private-sector counterparts. Government workers with a college degree averaged 15 percent more. But those with advanced degrees got 18 percent less than similar private-sector employees.