

Pop quiz: Has the US economy added jobs or lost jobs the last two months, according to official Bureau of Labor Statistics data? If one relied on the reporting of the media on jobs data, it would be easy to conclude that the number of jobs has risen, even if at a disappointing rate.
Most of the headlines on last week’s jobs report from April noted that the BLS reported a net gain of 115,000 jobs and a decline in the jobless rate to 8.1 percent, lower than it has gone at any time since the second month of President Obama’s term. Some even noted that the BLS upwardly revised the net-jobs gain in March from 120,000 to 154,000, which further implies that job growth continued in the 35th month of the recovery.
The impression, however, belies the actual overall jobs data, which few if any media outlets reported. According to the BLS, the number of actual jobs fell in April – and fell in March, too, the first two-month retreat in over a year.
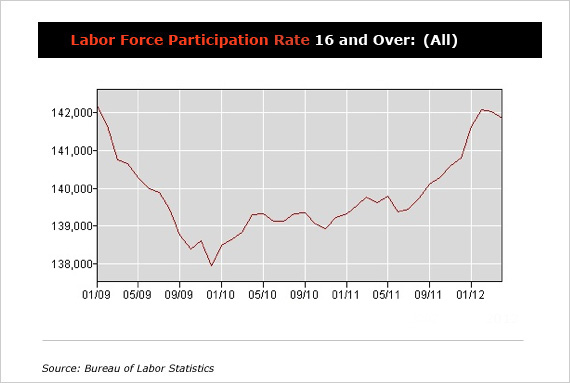
An historical look at the main A-1 table for seasonally-adjusted employment shows that the number of jobs in April fell to 141,865,000 — 169,000 fewer than in March. The job level in March came in 31,000 lower than in February. Here is the number of seasonally-adjusted jobs in the US economy since January 2009:
So what gives? The BLS actually conducts two surveys, a household poll called the Current Population Survey and a survey of business records called the Current Employment Statistics Survey. The former produces extensive demographic data to go along with overall employment data. The latter produces information on payrolls, hours worked, income, and so on.
The BLS merges some of this data to project the state of the American economy in its monthly employment reports. That process has been in place for decades, and is reliable – as long as one understands some of the basic assumptions that undergird the reported figures.
For instance, let’s look again at the chart above. One can argue that we have made up the ground lost in 2009 on jobs, or at least had until March and April of this year. That ignores the problem of population growth. Economists differ on how many net additions of working-age adults occur on an average each month, with a range from 100,000 to 160,000.
RELATED: Dismal Job Growth and Stagnation Will Unseat Obama
Even at the low end of the range, we would have added 3.9 million working-age adults to the workforce over this period of time, and at the more-accepted benchmark of 125,000 per month, that number goes up to 4.68 million. As this chart shows, just by getting back to the start of 2009, we are now 4 million jobs or more further in the hole.
If that’s the case, why hasn’t the unemployment rate gone up? The unemployment rate depends on the number of jobs, but it also depends on the number of people actively working or seeking jobs; the latter is called the civilian population participation rate, which serves as the denominator in the unemployment-rate equation.
Decrease the denominator, and the product decreases as well. In April, 522,000 people, and in March, 333,000 left before them. That’s nearly 900,000 workers who have left the workforce in just two months, while at the same time the number of jobs dropped by almost 200,000.
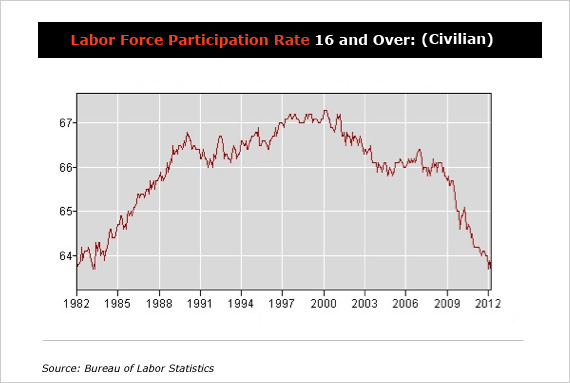
In fact, the civilian population participation rate hit a 30-year low in April, according to the BLS:
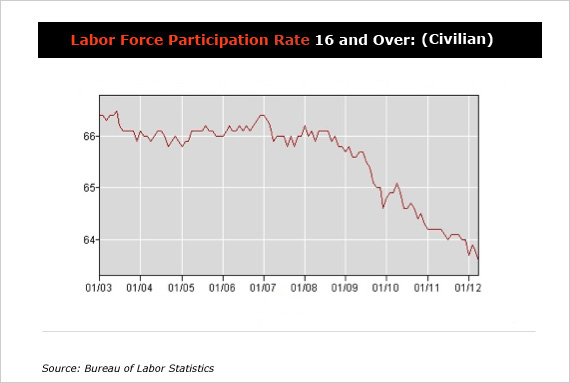
The Obama administration likes to blame the nation’s job woes on George Bush and , but as this chart shows, almost all of the decline took place after the start of the recovery in June 2009:
Some have argued that this trend shows nothing more than aging baby boomers heading into retirement as expected, but that’s not the case, either. Investors Business Daily reported from the BLS data that employment among workers 55 years of age and older has hit a new high, as boomers put off retirement – perhaps because of economic uncertainty, the debate over pensions, or the damage done to their retirement accounts in the 2008 crash.
The number of jobs for seniors has grown 3.9 million since the beginning of the recession in December 2007, hitting a 42-year high. That means, of course, that those jobs are not getting passed down to younger workers. The same data shows that there are 8.1 million fewer jobs for those under 55 in the same four-years-plus period.
The decline in workforce participation hasn’t come from natural outflow of workers in the boomer bubble to retirement, but from a lack of jobs in the economy. Indeed, if the civilian participation rate had remained where it was at in January 2009, the jobless rate today would be 11.1 percent, not 8.1 percent, and no one would be confused about the state of job creation and the economy.
Far from the impression that the media has given the last two months from the jobs reports, we are losing jobs and losing workers in 2012. One could understand how lay observers of economic data might miss that trend, but it’s odd that the same national media that provided so much handwringing over the supposedly slow rate of job growth in 2003-4 in the run-up to a presidential election demonstrates so little curiosity over the reality of job destruction in this election season.