More than three years after the worst economic crisis since the Great Depression, Labor Day 2012 finds American families still struggling to catch up from the devastating losses suffered during the downturn.

While this year’s presidential election will focus on the weak economic recovery of the Obama years, analysts say most households have been experiencing stagnant or declining incomes for more than a decade. Even at the top of the economic expansion that ended with the financial crisis of 2008-09, total household wages and salaries never returned to the peak reached in 2000, the last year of President Bill Clinton’s term in office, a new report shows.
The average household income for working families headed by someone under 65 has been on a downhill slide for more than a decade. The data, which can include multiple wage-earners but excludes people living alone, comes from the Economic Policy Institute, a liberal think tank whose annual “State of Working America” will be released next week.
“The labor market never really recovered during the 2000s,” said Josh Bivens, the chief labor market economist at EPI. “Unemployment may have reached 4 ½ percent by 2007, but if you look at the employment to population ratio, it never reached its late 1990s peak.”
And that was before households got hammered by the downturn. Average income fell by more than seven percent or nearly $5,000 between 2007 and 2010. Though data for households isn’t available for last year, there’s no way families made up much of that ground with unemployment stuck above 8 percent, Bivens said.
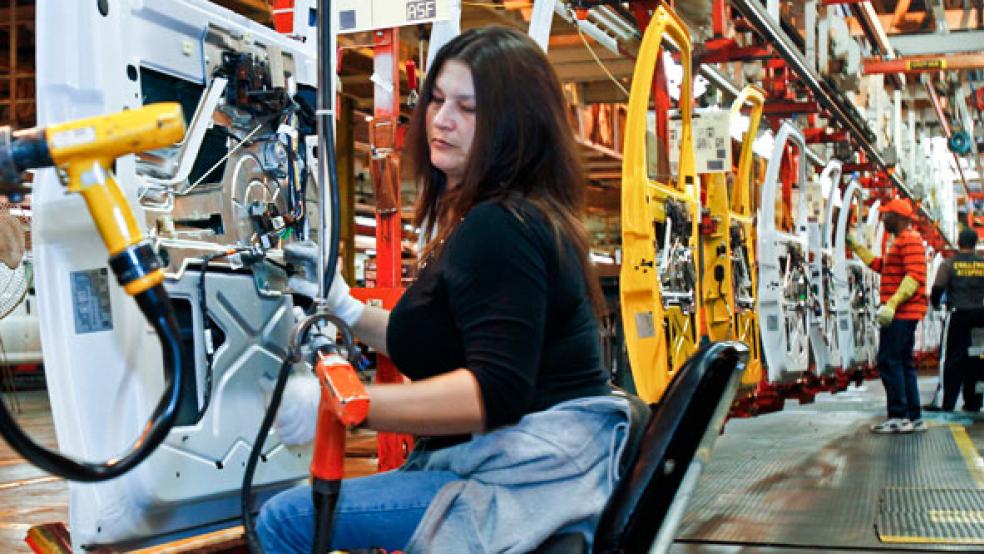
Another new report from the National Employment Law project helps explain why average household income is on a long-term downhill slide. Most new jobs generated during the Bush and Obama years have been either low-paying or high-paying, while middle-income jobs are disappearing.
Since the beginning of 2001, employment has grown by 8.7 percent in lower-wage occupations, defined as those earning between $7.69 and $13.83 an hour (adjust for inflation). Higher wage jobs, those earning between $21.14 and $54.55 an hour, grew by 6.6 percent over the decade. But middle-wage jobs like truck drivers and carpenters, who earn between $13.84 and $21.13 an hour, shrank by 7.3 percent, the report said.
The decline in middle-wage jobs was exacerbated by the Great Recession. Although the economy has added nearly three million jobs since the first quarter of 2010, low-wage occupations like retail sales, food preparation and hospital orderlies made up 58 percent of the total.
Middle-income positions made up just 22 percent of the new slots or about 600,000 new jobs. That was nowhere near enough to make up for the nearly 4 million positions in that pay range lost during the downturn. Professions that lost hundreds of thousands of slots included truck drivers, administrative assistants, carpenters and real estate brokers.
“These industries are not showing enough growth, and especially in the case of construction, are unlikely to get back to pre-recession levels any time soon,” wrote Annette Bernhardt, co-director of the National Employment Law Project, which advocates for better pay and benefits for low-wage workers.
Higher-wage jobs, many of which are salaried, also grew by over half a million jobs since early 2010, the report said. That was about equal to the number of middle-wage slots, but was not even half of what was lost during the downturn. The continuing decline of the information sector and layoffs in state and local government – many of them teachers, firemen and police – contributed to the decline in better-paying jobs.
Meanwhile, another new report documents the havoc that the downturn played on worker retirement prospects. In 2010, only 66 percent of workers had any form of retirement plan, either a defined benefit pension plan or a defined contribution savings plan like a 401(k). In 1980s, that total was 80 percent of all workers, according to the Employee Benefits Research Institute, and virtually all of them were in defined benefit pension plans.
Today, just 38 percent of workers have defined benefit plans while just 54 percent are in defined contribution plans. That totals more than 66 percent because some employees have both.
However, the average holdings in a defined contribution plan in 2010 was just $60,329. Of course, older workers nearing retirement tend to have the larger accounts.
Yet even employees over 60 who had been setting aside money since the mid-1980s when 401(k) accounts began had an average of just $202,329 in their accounts, according to the EBRI analysis. That’s enough to generate about a $1,037-per-month annuity at age 65.
Employee confidence that they’ll have enough money saved for retirement plunged sharply during the downturn, according to EBRI’s annual survey. In 2007, 70 percent said that they were either very or somewhat confident they’d have enough money set aside by the time they retire. Just 49 percent answered positively in 2011.
This year, that rebounded slightly to 52 percent, but it remains far below its pre-financial crisis high. The first annual survey, taken in 1993, registered an all time high of 73 percent. It has fallen fairly steadily ever since.
Yet this year’s survey also noted that retirement was not the major concern for most workers. “People say they’re more worried about their jobs than they are about retirement,” Jack VanDerhei, a retirement analyst at EBRI said last March when the survey was released. “They also say they plan to work longer and retire later than current employees.”