Behind the Housing Market’s Spring Surge

The housing market is emerging from its winter doldrums: Several different measures released this morning all point to a recent pickup in the real estate market.
Sales of existing homes jumped 6.1 percent in March to a seasonally adjusted annual rate of 5.19 million — well above expectations and the best month since September 2013. “The pickup in sales is echoed in stronger mortgage applications, new home sales, and faster rising prices—all suggesting a rebound in demand as the spring selling season approaches,” UBS economists wrote Wednesday.
Related: Why the Housing Market Is About to Perk Up
The median sale price last month was $212,100, up 7.8 percent from a year earlier (compared with a 7.2 percent annual gain as of February). “It looks like the combination of limited available inventory and a decline in the share of distressed sales in the market continue to put upward pressure on prices,” J.P. Morgan economist Daniel Silver wrote.

US Existing Home Sales data by YCharts
Mortgage purchase applications, meanwhile, rose 5 percent on a seasonally adjusted basis in the week ending April 17, suggesting that the increased activity from March has also continued into April.
Related: Americans Spend More on Taxes Than on Food, Clothing and Shelter
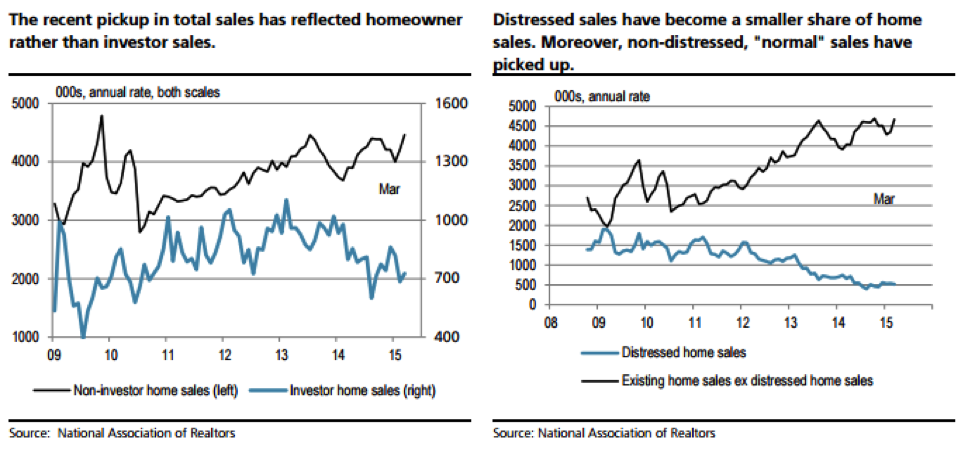
That trend may also reflect a policy change by the Federal Housing Administration in January. “Almost immediately after the mortgage insurance premium was cut by 50 basis points, purchase applications started to climb to highs not seen since the summer of 2013,” the IHS Global Insight economists Patrick Newport and Stephanie Karol wrote Wednesday. “We expect that the rule change will support market entry among younger buyers.” First-time homebuyers played an important part in the March increase, they suggest, as they increased their purchases by 10 percent year-over-year. Investors, meanwhile, bought 9 percent fewer properties than they had in March 2014, as the charts below from UBS detail.
The housing recovery had softened in recent months, even beyond the winter’s weather-related issues, so the new data — while not yet signaling a stronger trend — is an encouraging sign for increased activity in the spring and potentially beyond. “Home sales should pick up through the rest of 2015,” Gus Faucher, senior economist at PNC Financial Services Group, wrote Wednesday. “The fundamentals for housing are solid, with average job growth (200,000+ per month), good affordability, very low mortgage rates, increasing consumer confidence, expanding access to credit, and significant pent-up demand after years of depressed sales.”
Top Reads from The Fiscal Times:
- America’s Highest Paid CEO: It’s Not Who You Think
- Car Sales Are on Pace to Do Something They Haven’t in 50 Years
- The Companies Americans Hate Dealing With the Most
Chart of the Day: Boosting Corporate Tax Revenues

The leading candidates for the Democratic presidential nomination have all proposed increasing taxes on corporations, including raising income tax rates to levels ranging from 25% to 35%, up from the current 21% imposed by the Republican tax cuts in 2017. With Bernie Sanders leading the way at $3.9 trillion, here’s how much revenue the higher proposed corporate taxes, along with additional proposed surtaxes and reduced tax breaks, would generate over a decade, according to calculations by the right-leaning Tax Foundation, highlighted Wednesday by Bloomberg News.

Chart of the Day: Discretionary Spending Droops

The federal government’s total non-defense discretionary spending – which covers everything from education and national parks to veterans’ medical care and low-income housing assistance – equals 3.2% of GDP in 2020, near historic lows going back to 1962, according to an analysis this week from the Center on Budget and Policy Priorities.
Chart of the Week: Trump Adds $4.7 Trillion in Debt

The Committee for a Responsible Federal Budget estimated this week that President Trump has now signed legislation that will add a total of $4.7 trillion to the national debt between 2017 and 2029. Tax cuts and spending increases account for similar portions of the projected increase, though if the individual tax cuts in the 2017 Republican overhaul are extended beyond their current expiration date at the end of 2025, they would add another $1 trillion in debt through 2029.
Chart of the Day: The Long Decline in Interest Rates

Are interest rates destined to move higher, increasing the cost of private and public debt? While many experts believe that higher rates are all but inevitable, historian Paul Schmelzing argues that today’s low-interest environment is consistent with a long-term trend stretching back 600 years.
The chart “shows a clear historical downtrend, with rates falling about 1% every 60 years to near zero today,” says Bloomberg’s Aaron Brown. “Rates do tend to revert to a mean, but that mean seems to be declining.”

Chart of the Day: Drug Price Plans Compared

Lawmakers are considering three separate bills that are intended to reduce the cost of prescription drugs. Here’s an overview of the proposals, from a series of charts produced by the Kaiser Family Foundation this week. An interesting detail highlighted in another chart: 88% of voters – including 92% of Democrats and 85% of Republicans – want to give the government the power to negotiate prices with drug companies.
