
The 15 States Americans Are Ditching
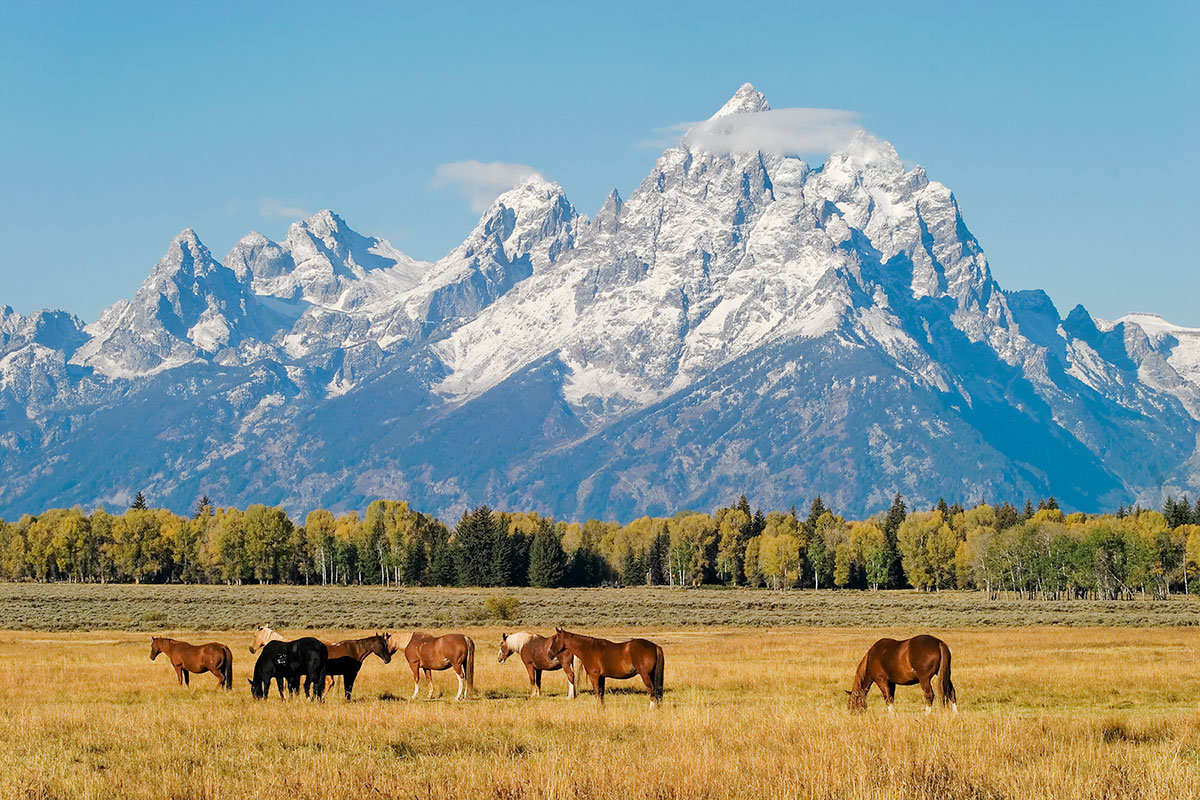
63 percent of all 2016 moves were outbound.
Unemployment rate (November 2016): 4.9 percent
GDP, Q2 2015-Q2 2016: -6.6 percent
*Atlas Van Lines added up the number of moves in a state. If the outbound moves represented 55 percent or more of the total, the state’s migration pattern was considered outbound.
Flickr / Matthew Paulson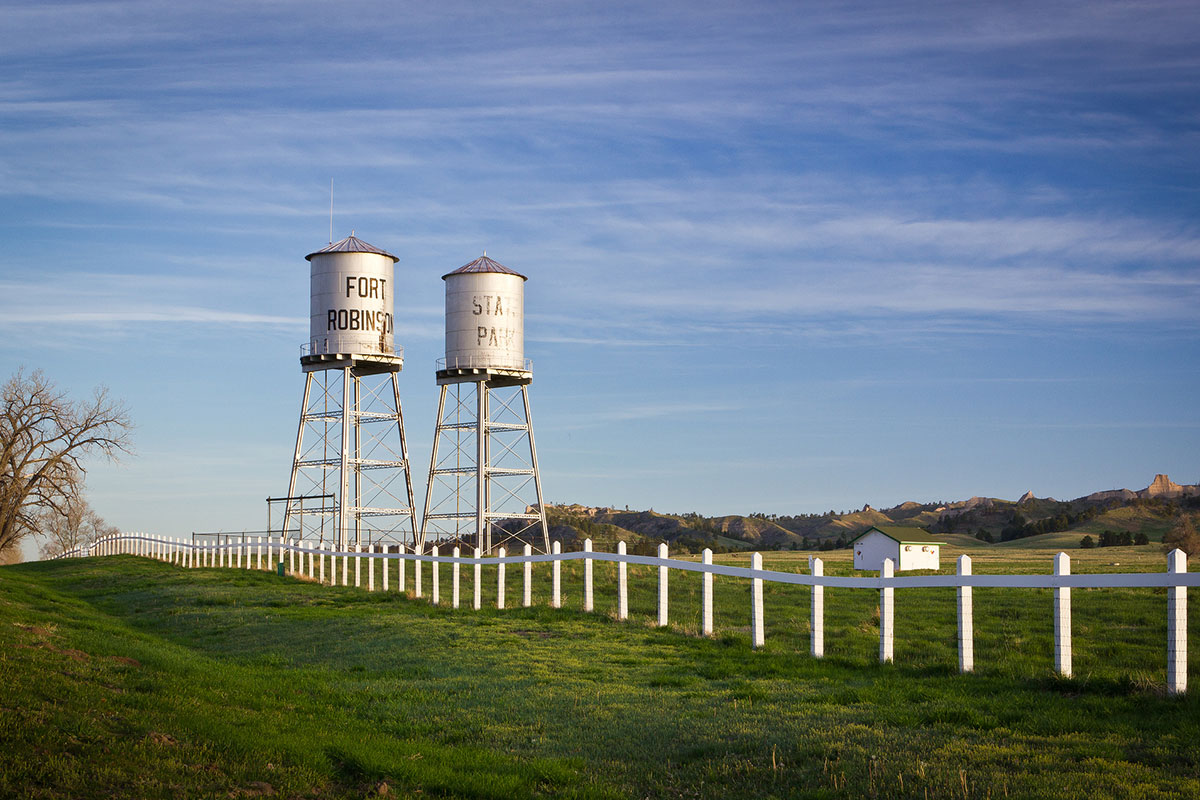
61 percent of all 2016 moves were outbound.
Unemployment rate: 3.4 percent
GDP, Q2 2015-Q2 2016: 1.3 percent

60 percent of all 2016 moves were outbound.
Unemployment rate: 5.6 percent
GDP, Q2 2015-Q2 2016: 1.8 percent

59.5 percent of all 2016 moves were outbound.
Unemployment rate: 4.3 percent
GDP, Q2 2015-Q2 2016: 0.8 percent

59 percent of all 2016 moves were outbound.
Unemployment rate: 6.2 percent
GDP, Q2 2015-Q2 2016: -1.1 percent

58.9 percent of all 2016 were outbound.
Unemployment rate: 4.7 percent
GDP, Q2 2015-Q2 2016: 0.1 percent
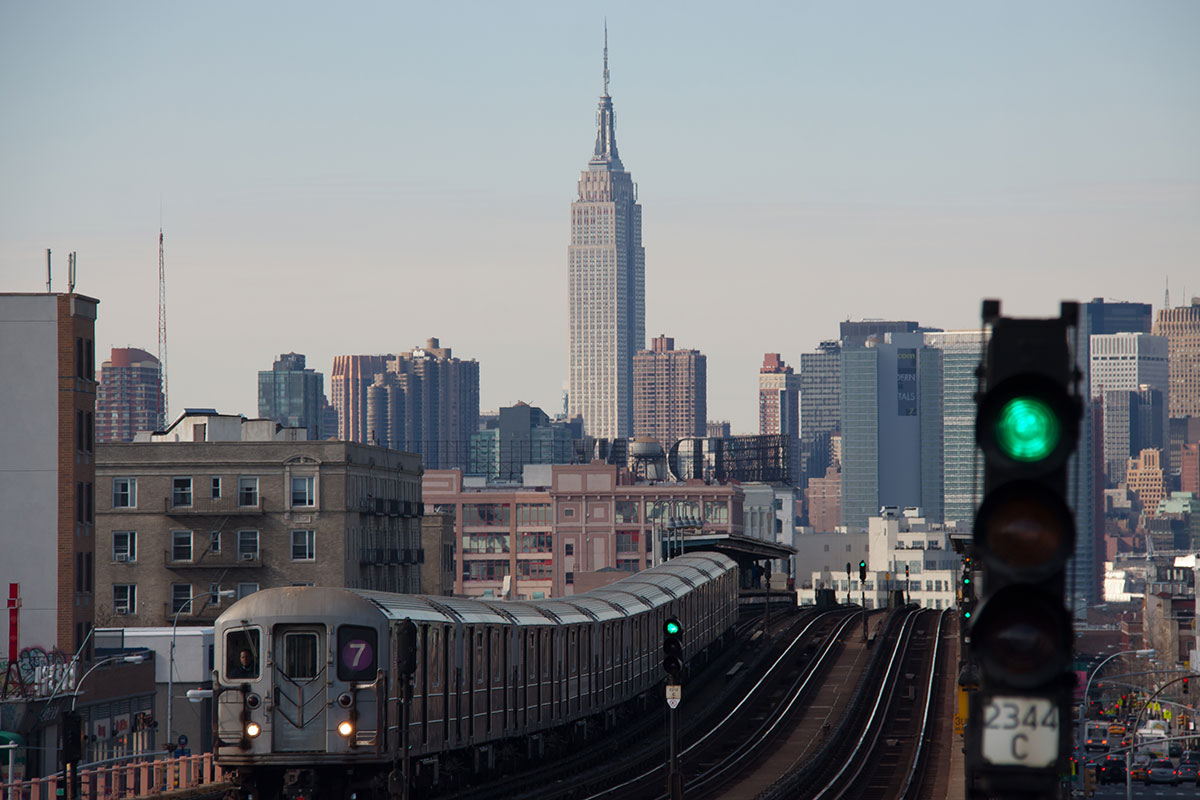
58.7 percent of all 2016 were outbound.
Unemployment rate: 5.1 percent
GDP, Q2 2015-Q2 2016: 0.9 percent

58.6 percent of all 2016 were outbound.
Unemployment rate: 6 percent
GDP, Q2 2015-Q2 2016: -3.1 percent
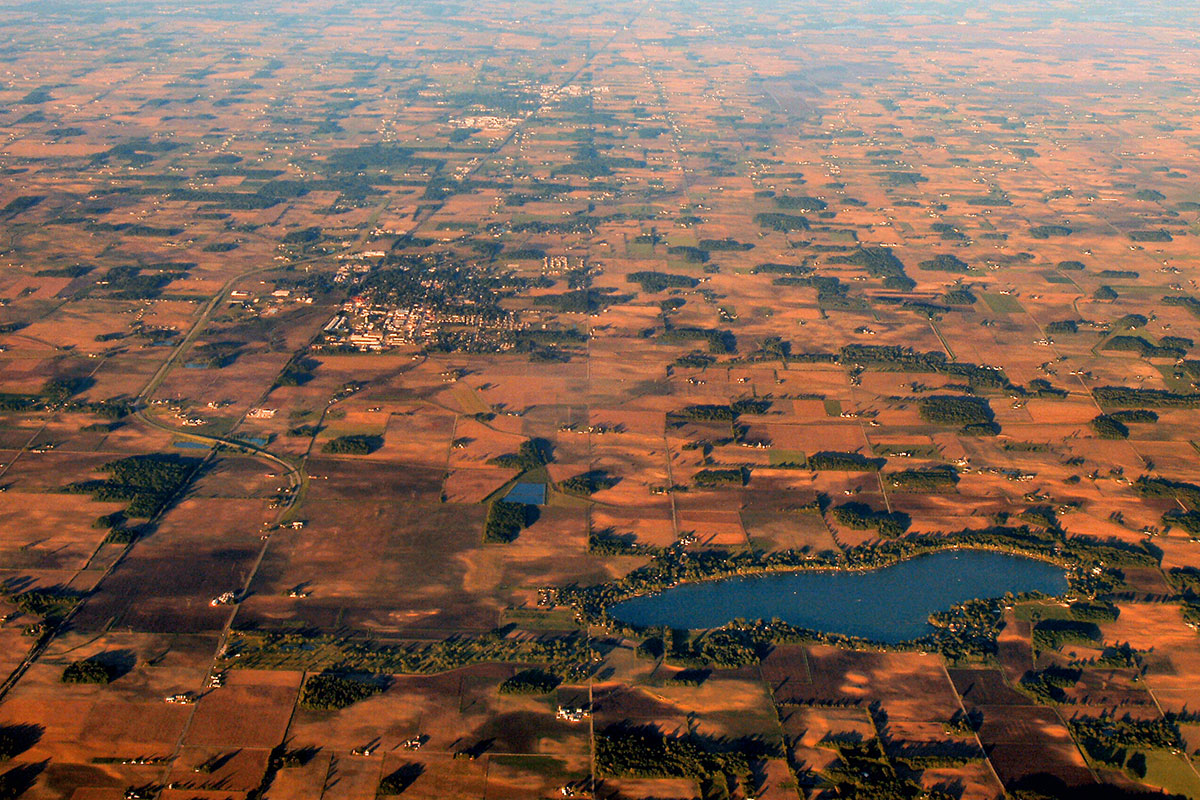
58 percent of all 2016 were outbound.
Unemployment rate: 4.2 percent
GDP, Q2 2015-Q2 2016: 1.5 percent

57.6 percent of all 2016 were outbound.
Unemployment rate: 2.7 percent
GDP, Q2 2015-Q2 2016: -0.8 percent

56.9 percent of all 2016 were outbound.
Unemployment rate: 3.8 percent
GDP, Q2 2015-Q2 2016: -1.4 percent
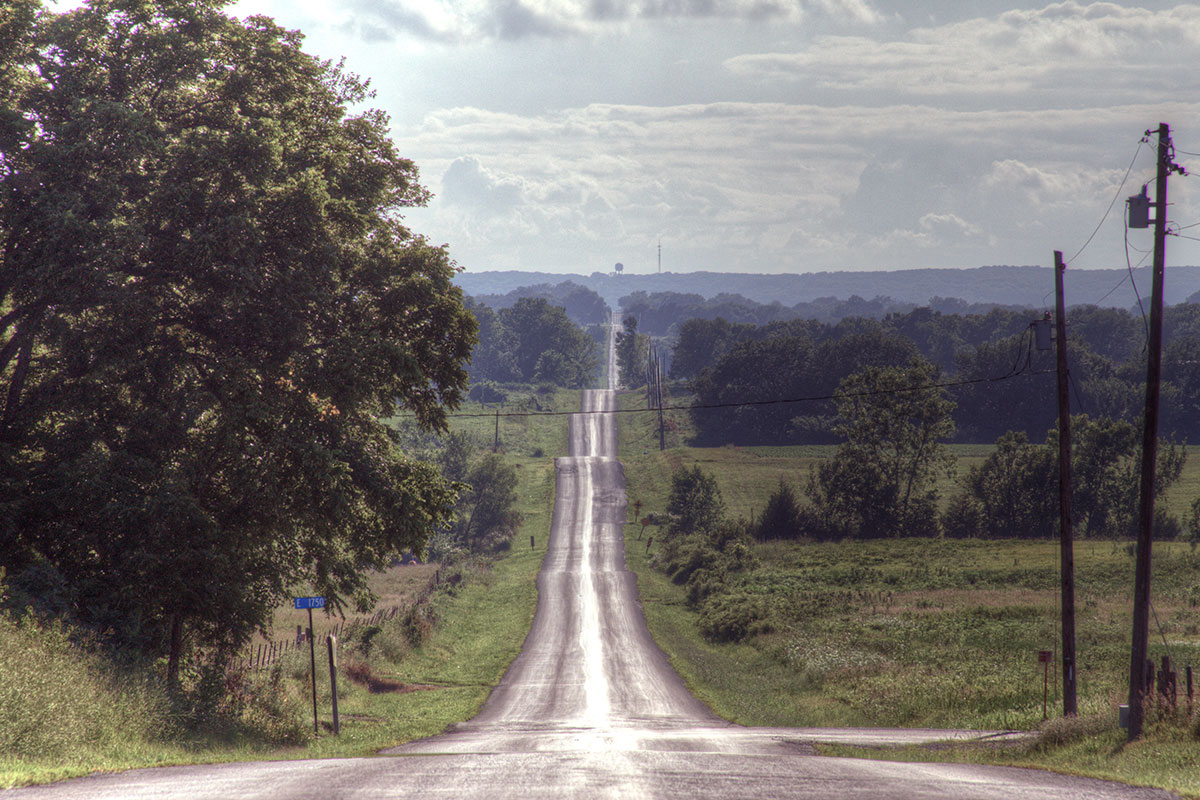
56.4 percent of all 2016 were outbound.
Unemployment rate: 4.3 percent
GDP, Q2 2015-Q2 2016: 0.4 percent

55.6 percent of all 2016 were outbound.
Unemployment rate: 3.2 percent
GDP, Q2 2015-Q2 2016: 2.2 percent

55.4 percent of all 2016 were outbound.
Unemployment rate: 4.9 percent
GDP, Q2 2015-Q2 2016: 0.9 percent
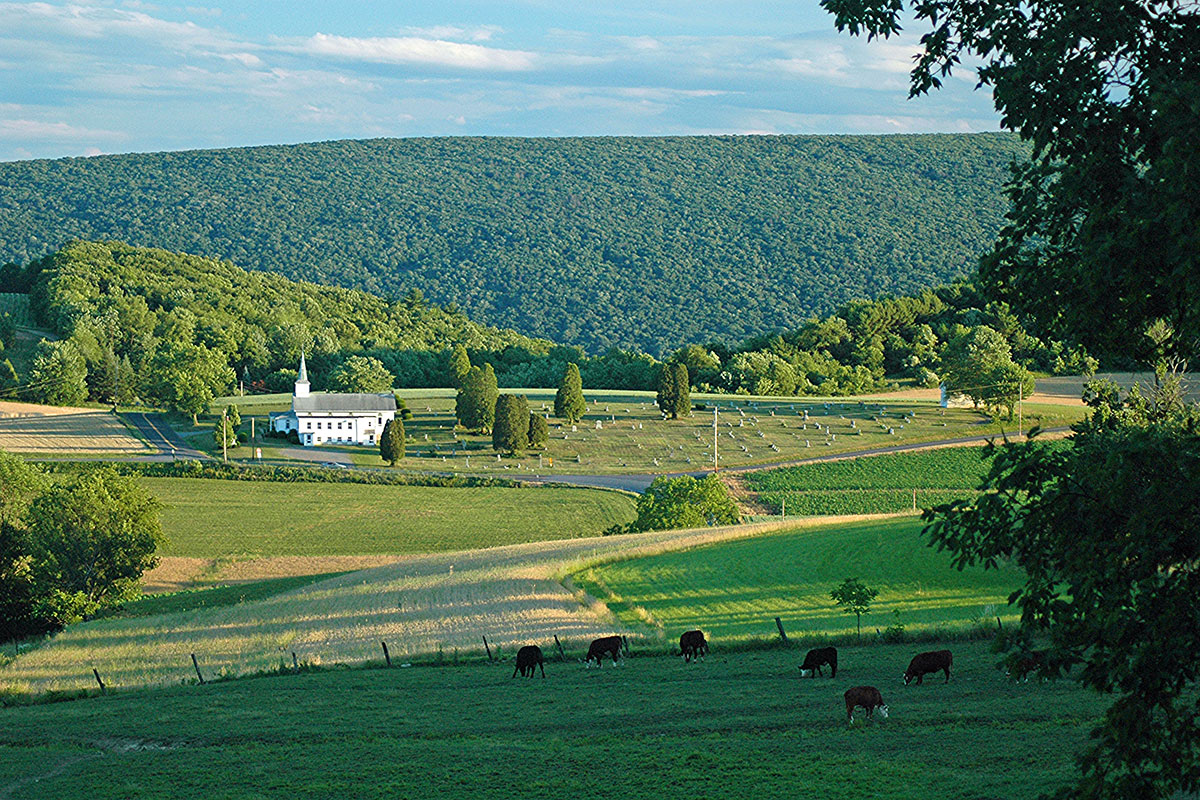
55.2 percent of all 2016 were outbound.
Unemployment rate: 5.7 percent
GDP, Q2 2015-Q2 2016: 0.1 percent