Giancarlo Stanton is now the highest paid player in the history of American professional sports. Well, sort of.
Earlier this week, the 25-year-old rightfielder signed a new contract with the Miami Marlins for a record $325 million over 13 years. Staggering stuff, especially when you consider the normally spendthrift Marlins had a total payroll of just $42 million in 2014.
At first blush, it sounds like a front-office blunder of historic proportions. How could any player possibly produce that kind of value? Haven’t we learned anything from the likes of A-Rod ($252 million for 10 seasons), Ryan Howard ($125/5), and Albert Pujols ($240/10)? How stupid could the Marlins be?
As it turns out, they’re not stupid at all. Quite to the contrary, there’s a very good chance Miami will come out ahead. How could that be? In a word, inflation.
Related: Madison Bumgarner and Baseball’s Screwball Salary System
The key to Stanton’s contract is timing. As economics teaches us, when you get paid influences what that compensation is worth to you. A dollar today is more valuable than a dollar tomorrow. That would be the case even without inflation because people are impatient. But when the price level is rising over time, the ticking clock becomes even more of a factor: The purchasing power of that same dollar diminishes.
Stanton’s contract is heavily backloaded. He’ll make just $6.5 million next season. The following year, just $9 million. Indeed, through the first six years of the contract he’ll have earned $107 million — a third of the total. Stanton can actually opt out of the deal at that point and try to land a contract that will pay him more than the $31 million he’d be making annually over the following seven years. And he might well choose to do that, given the history of rapidly rising baseball salaries.
That’s because inflation will come into play. In the U.S. economy as a whole, inflation tends to run around 2 percent annually, which is the target the Federal Reserve believes to be consistent with a healthy economy. Recently, though, it’s been quite a bit lower — low enough that many economists are concerned that deflation is a real threat. Part of the explanation seems to be continuing slack in the labor market, even as the unemployment rate has improved. Consequently, employers have not had to raise wages, and flat wages have meant that there’s little pressure on prices.
Baseball hasn’t had that problem. Expanding popularity and ever more lucrative TV deals have fueled steady revenue growth. With it, salaries have risen — baseball’s version of inflation. Depending on the precise calculation, inflation in baseball has tended average between 3.5 percent and 5.5 percent since 2000.
Related: MLB’s Real All-Stars: Which Teams Have Spent Their Money Best in 2014?
Inflation of this magnitude seriously impacts contracts. Take a look at the table below. For now, focus on the “Nominal Salary” and “Real Salary” columns. If “baseball inflation” is 3.5 percent over the course of Stanton’s deal, it’ll mean his real earnings — that is, his earnings valued in 2014 “baseball dollars” — will amount to just $247 million. It’s as if $78 million disappears into thin air. If baseball inflation is 5.5 percent, his earnings will amount to $213 million — a loss of a third of this contract.
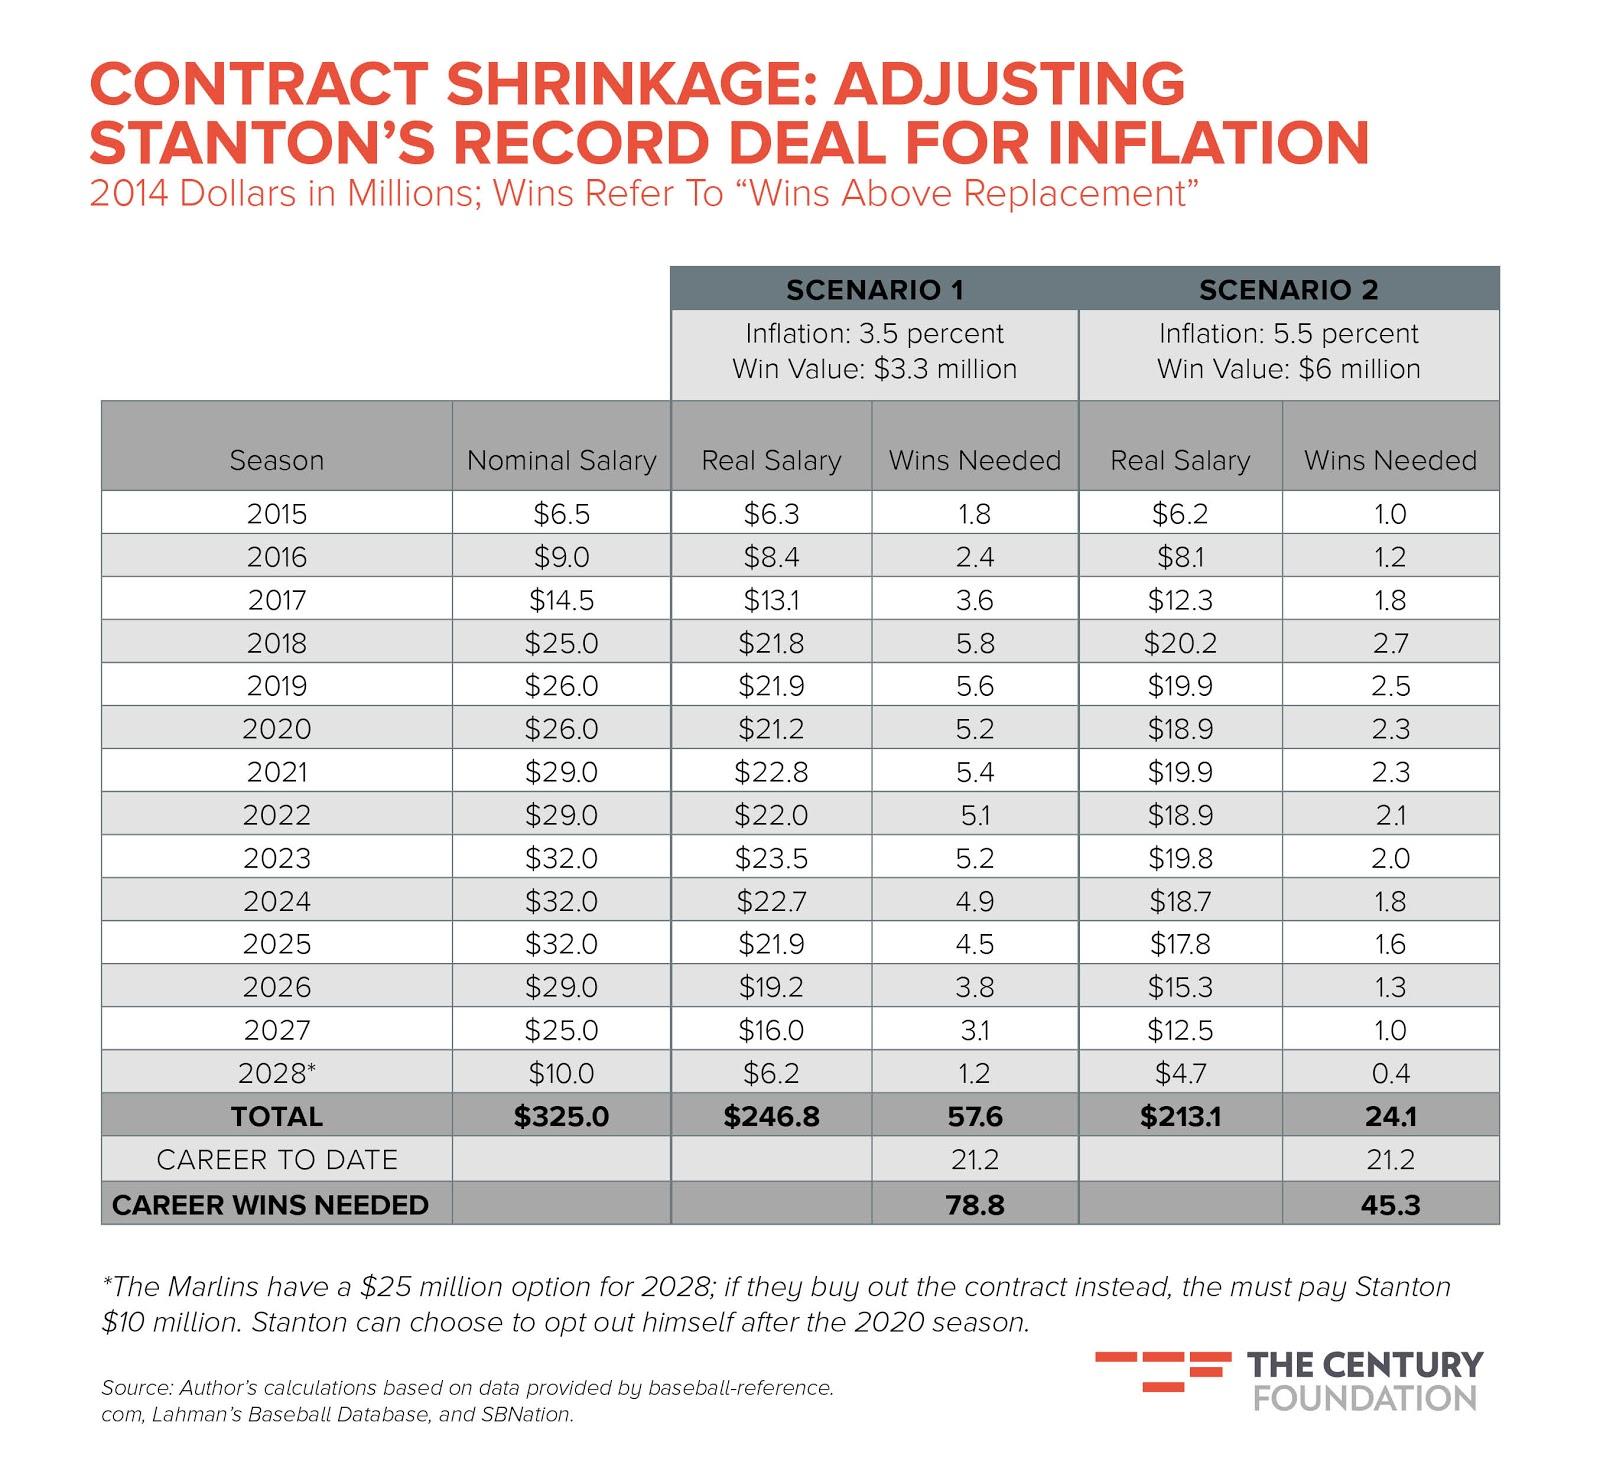
An aside: By “real baseball dollars,” I mean what Stanton earns relative to his peers signing new contracts in future years. Because the price of a player of Stanton’s caliber will increase, we have to adjust his future earnings to account for the fact that, in relative terms, Stanton’s locked-in contract will pay him less than what he would make if he signed a new contract each year. For example, if baseball inflation is 5.5 percent, the $32 million Stanton will make in 2025 is equivalent to making $17.8 million today. But remember, baseball is its own world. The value of Stanton’s earnings in the real economy is determined by regular inflation, which in all likelihood will be a lot lower. So his depreciating dollars will still buy plenty of big houses and expensive cars.
Will the Marlins Get Their Money’s Worth?
Let’s assume for now that Stanton stays with the team for the full 13 seasons covered by his new contract. How do the Marlins need him to perform in order to get their money’s worth?
The best way to measure a player’s performance is a statistic called “wins above replacement” or WAR. It combines everything a player does on the field into a single number: the wins the player contributed to his team’s total. A WAR of 2 is good enough to be a regular starter; a WAR above 4 or 5 is all-star territory.
Stanton has accumulated 21.2 wins in his first five seasons; his 6.5 WAR last year was good enough to get him second place in the NL MVP voting. Translating these wins into dollars depends upon how teams value wins. The methods of calculating dollars per win can be controversial, but there are two simple approaches. The first divides total MLB payroll by total league WAR, which, for recent seasons, comes out to a win value of about $3.3 million. But that figure includes young players who aren’t eligible for free agency. If we want to know the free market value of a win, we have to limit our calculation to only free agency-eligible players. Doing this produces a win value of about $6 million.
To compute break-even performance, all we have to do is divide Stanton’s salary (adjusted for inflation) by win value (also adjusted for inflation). The results are in the remaining columns of the table above. In the worst-case for the Marlins (Scenario 1), inflation is low and wins are cheap. To get their money’s worth, Stanton would have to produce about 58 wins over the life of his contract. In the best case (Scenario 2), inflation is high and wins are expensive. Stanton would need to produce just 24 wins in 13 years for it to be a profitable deal.
Related: The NFL’s Fantastic Finances — 14 Surprising Stats
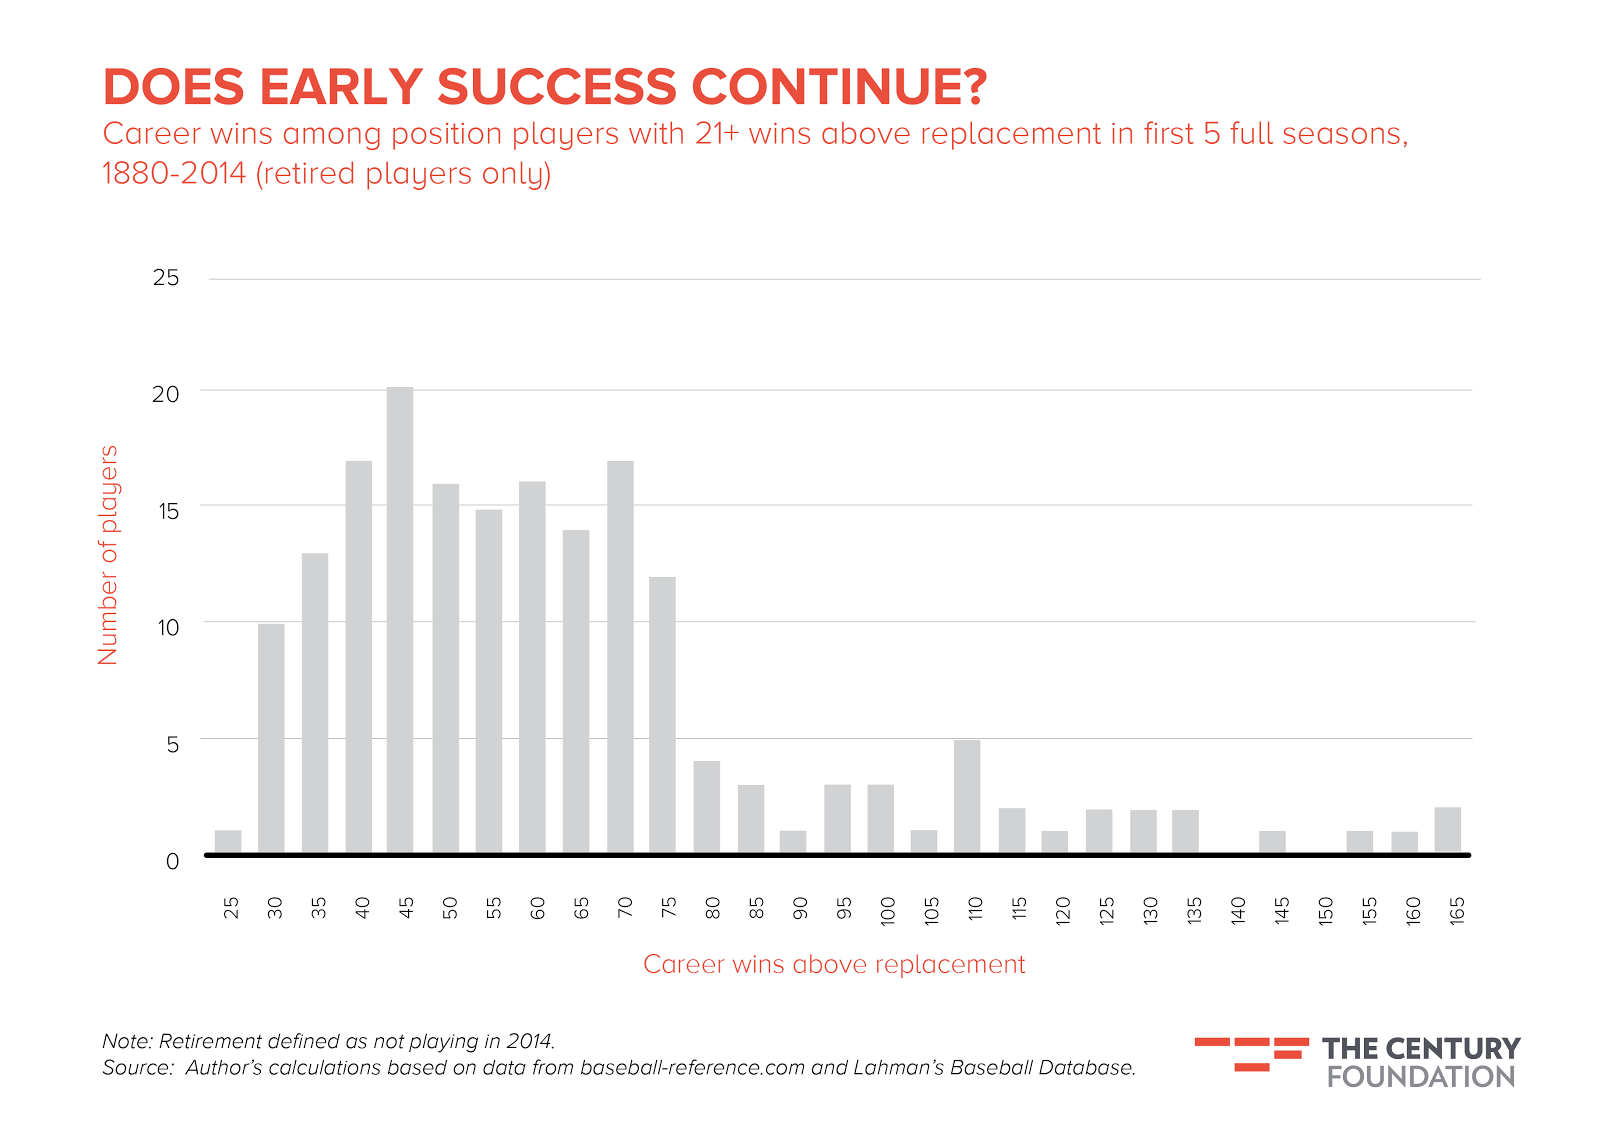
How likely are these outcomes? One way to get a handle on the probabilities is to look at past players who had similar resumes as Stanton. Dating back to 1880 (and including only players who retired by 2014), there have been 186 players who produced at least 21 wins in their first five full seasons. What did they go on to do? Two-thirds finished their careers with at least 45 wins — enough to make Stanton’s deal profitable in the best case scenario. Nearly one in five (17 percent) produced at least 79 wins, which means that even in the statistical worst case, the Marlins have a decent chance of things working out well.
When you consider Stanton has been seriously underpaid for his first five seasons (he’s made less than $10 million, total) and the fact that star players can generate revenue beyond on-field performance, the deck looks even more stacked in the Marlins’ favor.
We often hear policymakers speak of the dangers of inflation, but most of the time these threats are pretty invisible to most people. Stanton’s historic contract makes plain two of them. First, inflation creates unintentional transfers of wealth. Debtors like the Marlins get a boost (the value of the money they owe the player is reduced), while creditors like Stanton lose out. The second problem is related to the first: High inflation makes people unwilling to agree to long-term contracts because they fear getting stuck with a bad deal. But the alternative, frequent renegotiations, is hardly an improvement. Like frequent price resettings more generally — what economists call “menu costs” — bargaining imposes real costs on the parties involved, undermining economic efficiency.
Of course, these dangers could be avoided if people could adequately plan ahead. What matters is people’s expectations about inflation; if future price increases are anticipated, they can be built into contracts prospectively. But in the economy, as in baseball, the future is often unknowable, particularly when prices are changing rapidly, as they are in Major League Baseball today. At its most pernicious, inflation distorts what we think we know about the value of goods and services.
In other words, sometimes $325 million isn’t what it seems.
Mike Cassidy is a policy associate at The Century Foundation.
Top Reads from The Fiscal Times:
