Jamie Dimon Is Now a Billionaire

The vast majority of the billionaires in the U.S. made their money in one of two ways—they started a company, or they inherited their fortune or business.
But Jamie Dimon, chairman and CEO of JPMorgan Chase, has shown another path to riches. As a corporate manager, he may have amassed enough stock and boosted the share price enough to join the 10-figure club.
According to Bloomberg, Dimon is now worth $1.1 billion. His stake in JPMorgan through shares and options is worth $485 million and he also has real estate valued at $32 million. In addition, he has wealth from "an investment portfolio seeded by proceeds" from his previous stint at Citigroup.
Related: America’s Highest Paid CEO: It’s Not Who You Think
While highly unusual, Dimon isn't the first billionaire professional manager or executive who gained his wealth from stock in a company he didn't found or take public. The first manager-billionaire in the U.S. was believed to be Roberto Goizueta, CEO of Coca-Cola during the 1980s and 1990s. During his tenure, Coca-Cola's stock jumped more than 70-fold and Goizueta had stock and options totaling more than $1 billion.
More recently, the billionaire managers have been from finance. James Cayne, the colorful CEO and chairman of Bear Stearns became a billionaire on paper—before Bear Stearns collapsed during the financial crisis.
Richard Fuld, CEO of Lehman Brothers, also became a paper billionaire in 2007—before the investment bank became the largest bankruptcy in U.S. history in 2008.
Plenty of other finance chiefs have become billionaires—from hedge-funders to private-equity kings Steve Schwarzman and David Rubenstein. Citi founder Sandy Weill was a billionaire, but he created the company.
So while he may not be the first, Dimon may make history another way—by becoming the first manager-billionaire in finance to run a bank that thrives for decades after his leadership.
This article originally appeared on CNBC.
Read more from CNBc.
CNBC Charts the top 100 firms
Shift from slaes to planning fuels fee-only business
Harvard Receives Laegest Ever Gift
Chart of the Day: Boosting Corporate Tax Revenues
The leading candidates for the Democratic presidential nomination have all proposed increasing taxes on corporations, including raising income tax rates to levels ranging from 25% to 35%, up from the current 21% imposed by the Republican tax cuts in 2017. With Bernie Sanders leading the way at $3.9 trillion, here’s how much revenue the higher proposed corporate taxes, along with additional proposed surtaxes and reduced tax breaks, would generate over a decade, according to calculations by the right-leaning Tax Foundation, highlighted Wednesday by Bloomberg News.
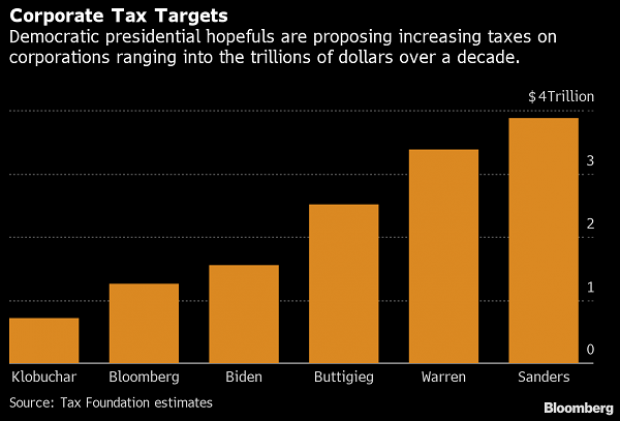
Chart of the Day: Discretionary Spending Droops
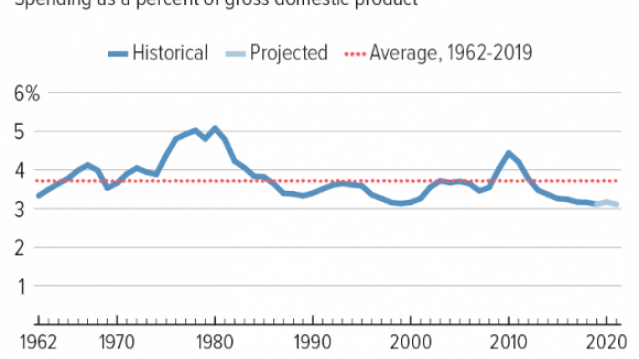
The federal government’s total non-defense discretionary spending – which covers everything from education and national parks to veterans’ medical care and low-income housing assistance – equals 3.2% of GDP in 2020, near historic lows going back to 1962, according to an analysis this week from the Center on Budget and Policy Priorities.
Chart of the Week: Trump Adds $4.7 Trillion in Debt
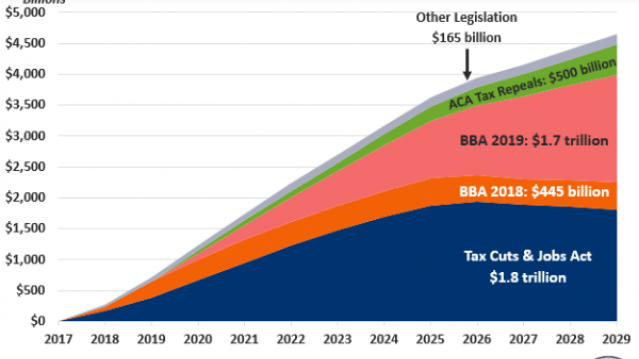
The Committee for a Responsible Federal Budget estimated this week that President Trump has now signed legislation that will add a total of $4.7 trillion to the national debt between 2017 and 2029. Tax cuts and spending increases account for similar portions of the projected increase, though if the individual tax cuts in the 2017 Republican overhaul are extended beyond their current expiration date at the end of 2025, they would add another $1 trillion in debt through 2029.
Chart of the Day: The Long Decline in Interest Rates

Are interest rates destined to move higher, increasing the cost of private and public debt? While many experts believe that higher rates are all but inevitable, historian Paul Schmelzing argues that today’s low-interest environment is consistent with a long-term trend stretching back 600 years.
The chart “shows a clear historical downtrend, with rates falling about 1% every 60 years to near zero today,” says Bloomberg’s Aaron Brown. “Rates do tend to revert to a mean, but that mean seems to be declining.”
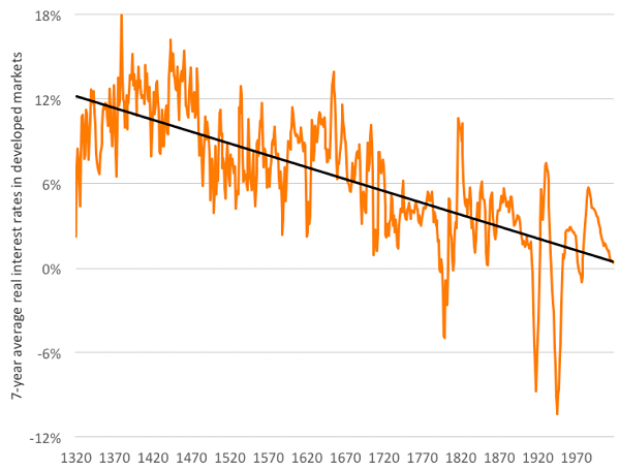
Chart of the Day: Drug Price Plans Compared

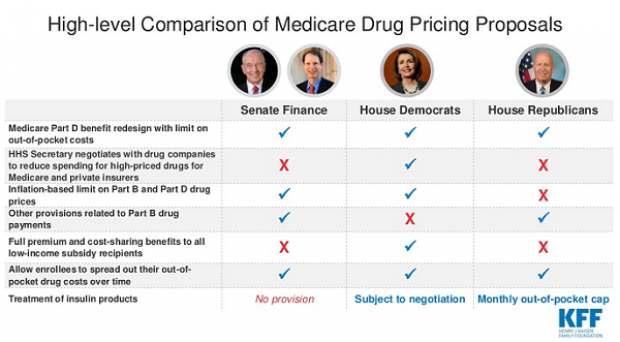
Lawmakers are considering three separate bills that are intended to reduce the cost of prescription drugs. Here’s an overview of the proposals, from a series of charts produced by the Kaiser Family Foundation this week. An interesting detail highlighted in another chart: 88% of voters – including 92% of Democrats and 85% of Republicans – want to give the government the power to negotiate prices with drug companies.
