The 15 Most Valuable NFL Teams
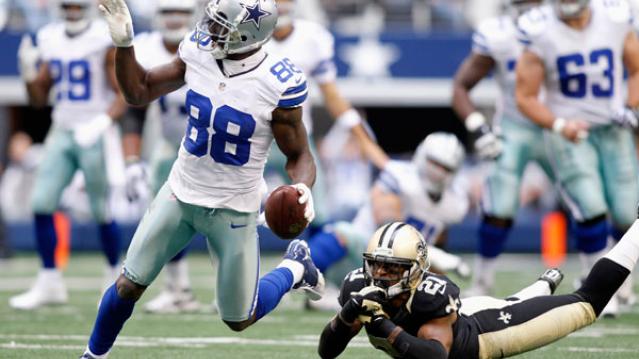
The New England Patriots may be reigning Super Bowl champs and have the most successful quarterback-coach pair in NFL history -- Tom Brady and Bill Belichick each have four championship rings with the Pats -- but they’re missing something nevertheless.
As they kick off the season tonight against the Pittsburgh Steelers, the Pats aren’t at the top of the NFL in terms of team value. That title still goes to the Dallas Cowboys, according to an analysis at Forbes.
Related: 10 Big Money NFL Draft Busts
Dallas must be feeling pretty good about beating New England at something. They had the same regular season record as the Patriots last year, with 12 wins and 4 losses, but ended the season with a loss to the Green Bay Packers in the divisional playoffs, while the Pats went on to win Super Bowl XLIX (that’s 49 for all you non-Romans out there).
Even though the Washington Redskins have been playing pretty pathetically for the past decade, they still come in third. Washington’s NFC East rival, the New York Giants, rank fourth at $2.1 billion.
Here are the 15 most valuable NFL teams:
- Dallas Cowboys - $3.2 billion
- New England Patriots - $2.6 billion
- Washington Redskins - $2.4 billion
- New York Giants - $2.1 billion
- Houston Texans - $1.85 billion
- New York Jets - $1.8 billion
- Philadelphia Eagles - $1.75 billion
- Chicago Bears - $1.7 billion
- San Francisco 49ers - $1.6 billion
- Baltimore Ravens - $1.5 billion
- Denver Broncos - $1.45 billion
- Indianapolis Colts - $1.4 billion
- Green Bay Packers - $1.38 billion
- Pittsburgh Steelers - $1.35 billion
- Seattle Seahawks - $1.33 billion
Top Reads from the Fiscal Times:
- After the Fiorina Fiasco, What Insult Will Trump Fling Next?
- $42 Million for 54 Recruits? U.S. Program to Train Syrian Rebels Is a Disaster
- A Military Coup in the U.S.? A Surprising Number of Americans Might Support One
Chart of the Day: Boosting Corporate Tax Revenues
The leading candidates for the Democratic presidential nomination have all proposed increasing taxes on corporations, including raising income tax rates to levels ranging from 25% to 35%, up from the current 21% imposed by the Republican tax cuts in 2017. With Bernie Sanders leading the way at $3.9 trillion, here’s how much revenue the higher proposed corporate taxes, along with additional proposed surtaxes and reduced tax breaks, would generate over a decade, according to calculations by the right-leaning Tax Foundation, highlighted Wednesday by Bloomberg News.
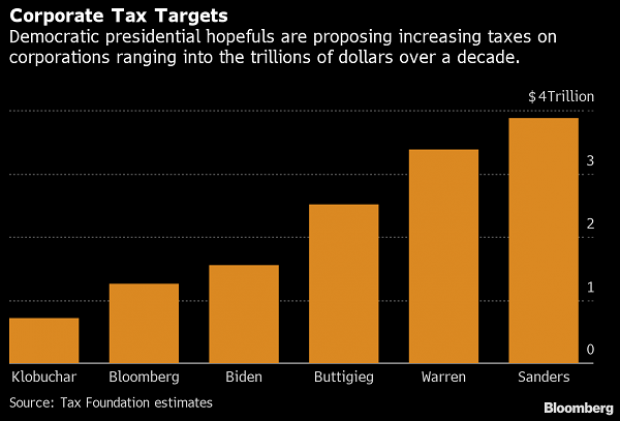
Chart of the Day: Discretionary Spending Droops
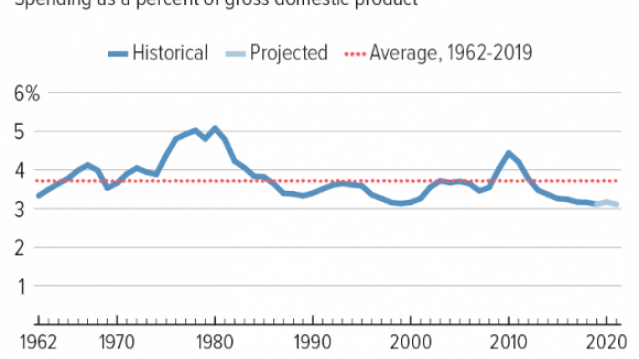
The federal government’s total non-defense discretionary spending – which covers everything from education and national parks to veterans’ medical care and low-income housing assistance – equals 3.2% of GDP in 2020, near historic lows going back to 1962, according to an analysis this week from the Center on Budget and Policy Priorities.
Chart of the Week: Trump Adds $4.7 Trillion in Debt
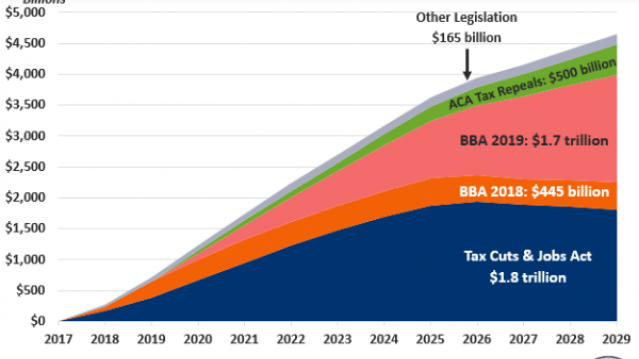
The Committee for a Responsible Federal Budget estimated this week that President Trump has now signed legislation that will add a total of $4.7 trillion to the national debt between 2017 and 2029. Tax cuts and spending increases account for similar portions of the projected increase, though if the individual tax cuts in the 2017 Republican overhaul are extended beyond their current expiration date at the end of 2025, they would add another $1 trillion in debt through 2029.
Chart of the Day: The Long Decline in Interest Rates

Are interest rates destined to move higher, increasing the cost of private and public debt? While many experts believe that higher rates are all but inevitable, historian Paul Schmelzing argues that today’s low-interest environment is consistent with a long-term trend stretching back 600 years.
The chart “shows a clear historical downtrend, with rates falling about 1% every 60 years to near zero today,” says Bloomberg’s Aaron Brown. “Rates do tend to revert to a mean, but that mean seems to be declining.”
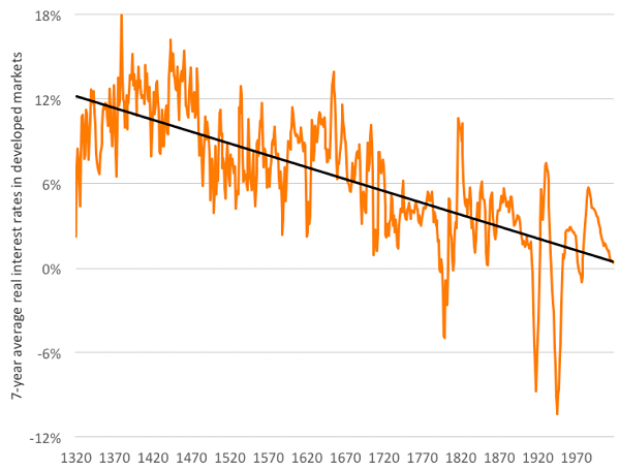
Chart of the Day: Drug Price Plans Compared
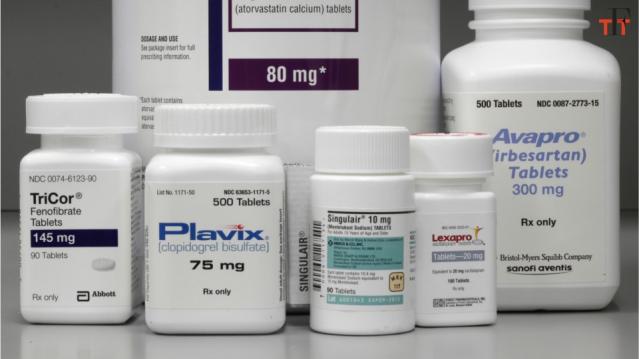
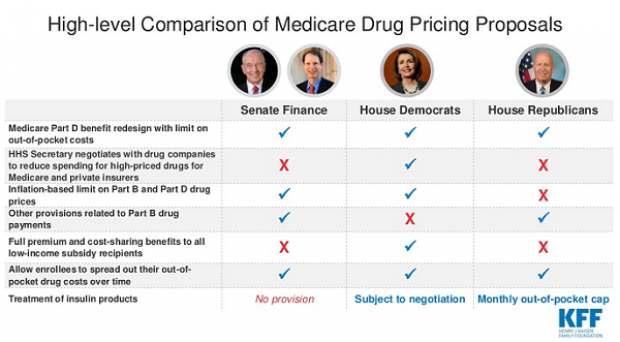
Lawmakers are considering three separate bills that are intended to reduce the cost of prescription drugs. Here’s an overview of the proposals, from a series of charts produced by the Kaiser Family Foundation this week. An interesting detail highlighted in another chart: 88% of voters – including 92% of Democrats and 85% of Republicans – want to give the government the power to negotiate prices with drug companies.
