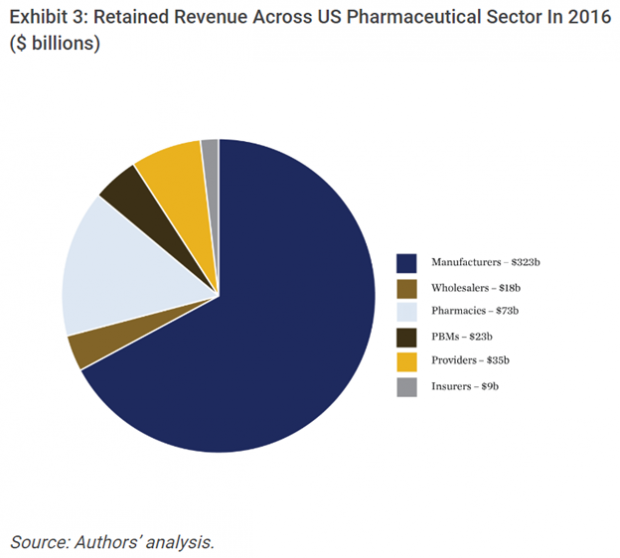
U.S. spending on pharmaceuticals totaled $480 billion in 2016, according to a report published this week in Health Affairs.
“Two-thirds of this total ($323 billion) was captured by drug manufacturers in the form of net revenues,” the researchers from Memorial Sloan Kettering’s Center for Health Policy and Outcomes write. “The remaining third ($157 billion) was retained as gross profits in the supply chain. Of this share, nearly half was captured by retail and specialty pharmacies ($73 billion), and about 20 percent ($35 billion) by providers, such as hospitals and doctors’ offices. PBMs and wholesalers together captured approximately 25 percent ($23 billion and $18 billion, respectively).”
The takeaway: The analysis — which factors in the entire prescription drug supply chain, including pharmacies and pharmacy benefit managers as well as drugmakers themselves — shows that prescription drugs make up closer to 15 percent of all health care spending rather than the 10 percent more typically cited.