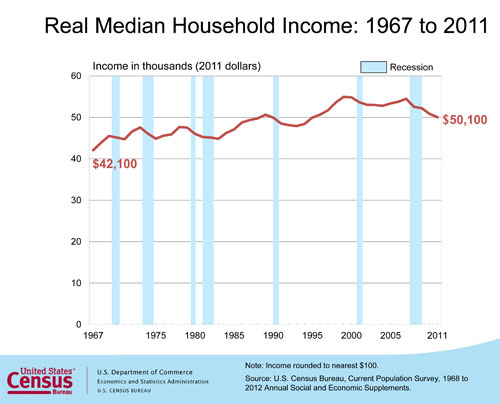
In the aftermath of the Great Recession, household income dropped once again in 2011 while the poverty level stayed flat after three straight years of increases, the Census Bureau said Wednesday. Median household incomes adjusted for inflation fell 1.5 percent to $50,054. That’s 8.1 percent lower than it had been in 2007, the year before the recession, and almost 9 percent lower than the peak income level reached in 1999. The last time median household income was lower was 1995 – meaning it’s been a lost decade and a half for Americans looking to get ahead.
The gross domestic product has gone from $7.4 trillion to $15.1 trillion in current-dollar terms over that time, suggesting that families have fallen behind even as the economy has expanded.
RELATED: Are You Better Off? Here Are the Numbers
The poverty rate last year dipped from 15.1 percent to 15 percent, a statistically insignificant change, as the number of people living in poverty stayed at 46.2 million, including 16.1 million children. Census Bureau officials suggested that workers shifting from part-time to full-time work as the employment picture improved may have helped keep the poverty level stable. Expanded unemployment benefits also helped.
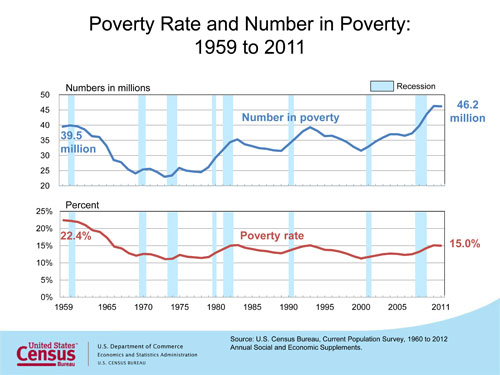
The Census Bureau’s poverty figures measure income before taxes and don’t account for items like the Earned Income Tax Credit or food stamps. The average poverty threshold is $11,484 for individuals, or $23,021 for a family of four.
RELATED: Revisiting the War on Poverty: Poverty Didn’t Win
Besides the relatively rotten economy, demographic trends may also be weighing on the household income figures. Among Americans age 55-64, real median income fell 4 percent from 2010 to 2011 following a drop of more than 2 percent from 2009 to 2010. And the number of elderly households, which typically have lower income than households with workers in their prime earning years, is on the rise, up 4.3 percent to 26.8 million from 2010 to 2011. “Since the median income of elderly households is much lower than the median of nonelderly households, the growing number of elderly households will tend to lower overall median household income over time,” Ed Welniak, who heads the Census Bureau’s income statistics branch, noted in a blog post.
The Census report included another sign of the economic challenges faced by average Americans: the gap between the highest earning households and those lower down the income scale widened from 2010 to 2011. While the top 5 percent of households gained 5.3 percent and the top fifth gained 1.6 percent, the bottom fifth saw no change – and the three-fifths in the middle got hit hardest, with their income falling between 1.6 and 1.9 percent.