Stocks edged up to new highs on Tuesday thanks, in large part, to a blip at the closing bell that pushed the major averages out of negative territory. As of yesterday’s close, the major averages are all up more than 5 percent, with the S&P 500 crossing the 2,100 level for the first time.
Sentiment has rarely been higher, with a measure that looks at how comfortable traders are holding individual stocks rather than safer broad market ETFs now at one of its highest levels of the bull market to date. Despite some weakness Wednesday morning, stocks continue to resist any significant selloff, shrugging off recent volatility in bonds, commodities and currencies.
Related: Gold on a Roll and It Could Go Higher
Nothing, it seems, can shake the faith investors have in this market. And that has me worried.
They assume that the situation in Greece will be saved with another last-minute deal, ignoring the growing risks of a "Grexit" as negotiations break down in acrimony. Moreover, the European Central Bank could soon pull its support of Greece's financial system, as imbalances build within the pan-Euro Target2 system amid Greek deposit outflows.
This, along with ongoing strength in crude oil (which, in turn is boosting energy stocks), has whipped investors into frenzy, according to the latest Investors Intelligence survey. The share of bulls increased to 52.5 percent for the week, up from 49 percent the week before, while the bears slipped to 15.2 percent from 16.3 percent. The spread has widened to levels not seen since the end of December. Higher risk appetites can also be seen in the inflows pouring into high-yield bond funds, totaling nearly $9 billion over the last three weeks, according to Bank of America Merrill Lynch. That’s the largest surge on record.
Related: Why Oil Prices Will Rebound Before We Know It
For reality-based analysts, it's all a little much.
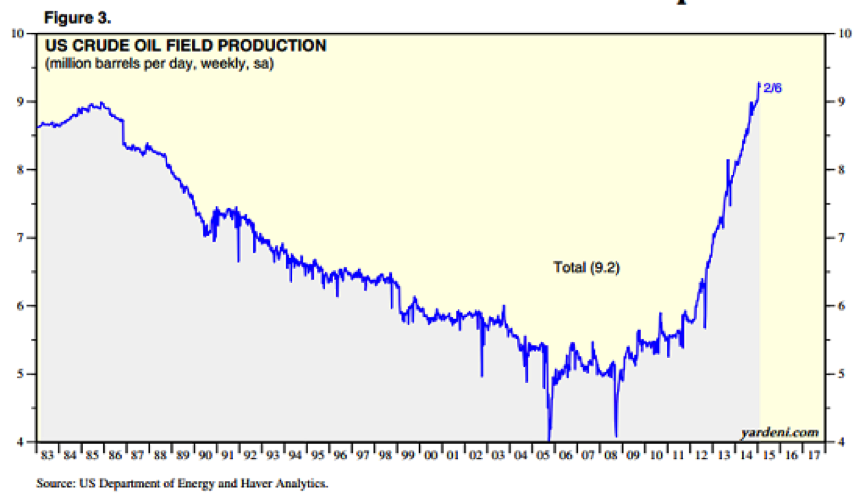
The rise in crude oil, for instance, has been driven by falling rig count data (down 34 percent from the October peak) as well as capital expenditure cuts by drilling companies. Still, with production pushing higher and inventories near 80-year highs, analysts continue to warn that prices will likely push lower again to encourage actual output cuts.
In fact, Citigroup warned that prices could briefly trade as low as $20 a barrel.
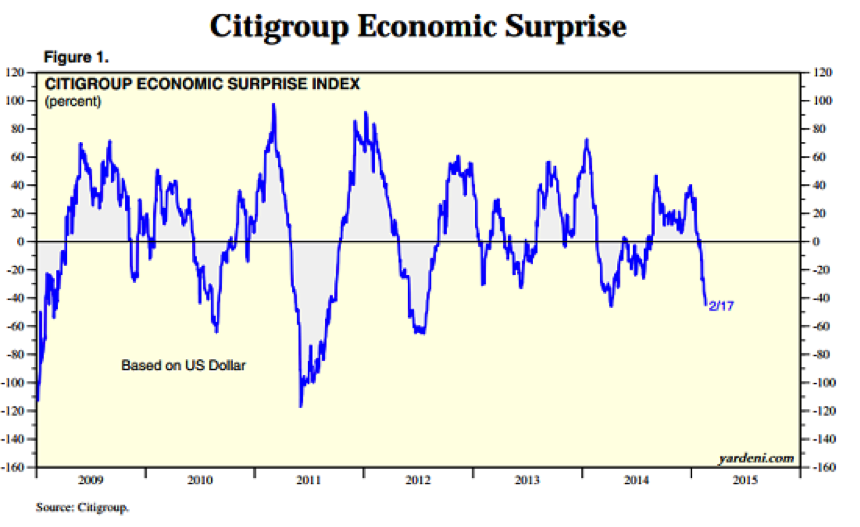
Also, the U.S. economic data is rolling over, as shown in the Citigroup Economic Surprise Index above. After peaking late last year, the index has collapsed rapidly back to early 2014 lows, with a variety of data points — from factory orders to retail sales and consumer confidence — recently missing to the downside. On Tuesday, we got soft readings on the housing market via the NAHB housing market index and factory activity via the Empire State Manufacturing Index.
There's more.
The Economic Cycle Research Institute, which maintains its forward looking Weekly Leading Index to peer around the corner of the economic cycle and divine what lies ahead, has fallen to levels not seen in three years — a level that, outside of the current economic expansion, has only been seen seven other times since the 1970s.
Here's the rub: Six of these marked the start of recessions.
Related: Americans’ 401(k) Totals Just Reached a New Record. Don’t Celebrate Yet…
Technically, there are problems with the rally we've seen since the end of January. Basically, it's been all about Apple (NASDAQ:AAPL), which is up some 22 percent from its low last month on excitement over its new bond issue denominated in Swiss francs and a big production order for its upcoming Apple Watch as well as buzz surrounding a possible electric car initiative.
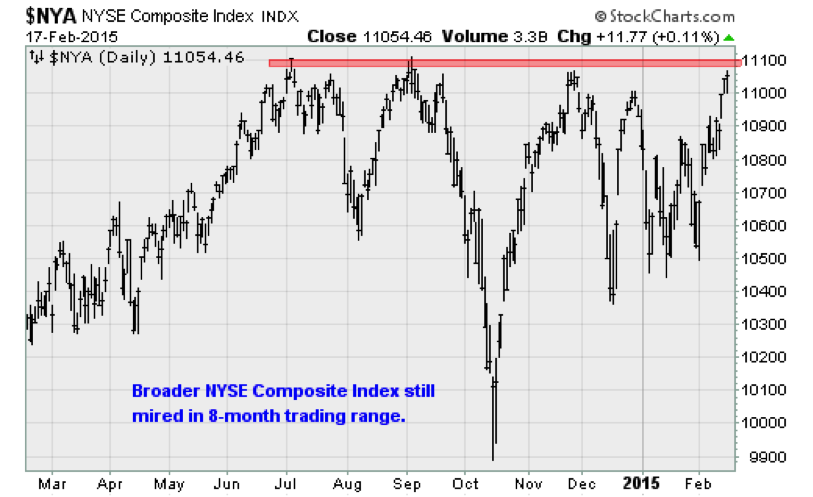
Outside of Apple, though, the action has been more tepid: The chart above of the NYSE Composite Index, which takes a broader, more inclusive look at what's happening in stocks, is still mired in the trading range that started last July. For the fourth time, we are testing resistance near 11,100. Breadth remains disappointing, with only 72 percent of the stocks in the S&P 500 in uptrends vs. 76 percent in December and 85 percent last July.
Consider that on Tuesday, despite the push to new records, there were 434 net declining issues on the NYSE.
This is a dangerous situation, with expectations so high and separated from the situation on the ground that it won't take much disappointment for reality to come rushing back in. Maybe that's why the CBOE Volatility Index (VIX), Wall Street's "fear gauge," increased 7.6 percent for its first gain in a week.
How dangerous a situation? How about July/October 2007 dangerous?
Jason Goepfert at SentimenTrader notes that the last time the S&P 500 closed at a new 52-week high while the VIX was more than 50 percent above its 52-week low as Oct. 5, 2007. Before that was July 12, 2007. Both coincided with the double-top that marked the terminus of the last bull market.
Related: The Stock Market Is Weaker Than It Looks
Options traders are bidding up the VIX by piling into put option contracts that profit should stocks go down. This is corroborated by an alternative measure compiled by Credit Suisse, which they've dubbed the Fear Barometer, which recently spiked to one of its highest levels in history and continues a cluster of elevated readings that started last summer.
I sympathize, as there are a number of real-world problems that, in my mind, are more important than the hype surrounding Apple, such as the fact that the QE3 bond purchase program is over and that the Fed is moving toward its June rate hike window. This is a stock market that's growing increasingly dependent, and less satisfied, by the flow of stimulus from the Fed. The end of the QE1 and QE2 programs were associated with major market pullbacks of 20 percent or more.
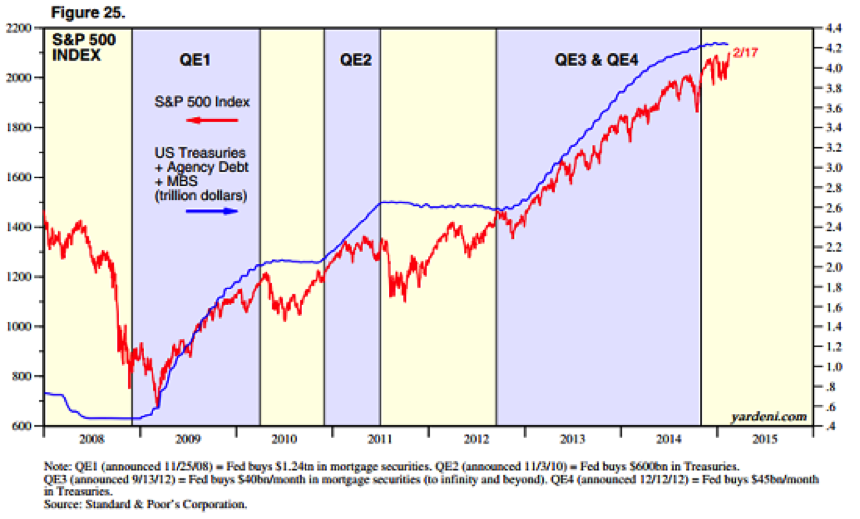
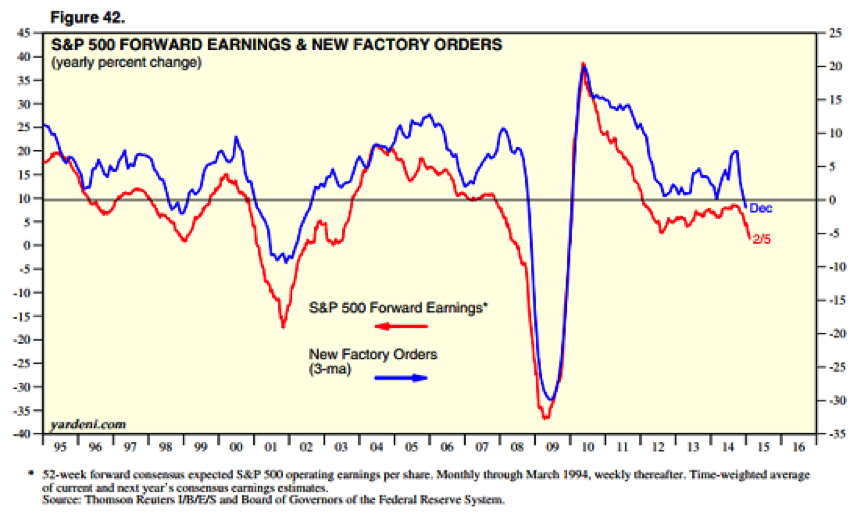
Also troubling is the fact that both corporate earnings and factory activity are rolling over, as shown in the chart below. The drop in earnings has many causes, from overseas weakness to currency effects to lower energy prices to the specter of higher labor costs as the job market tightens.
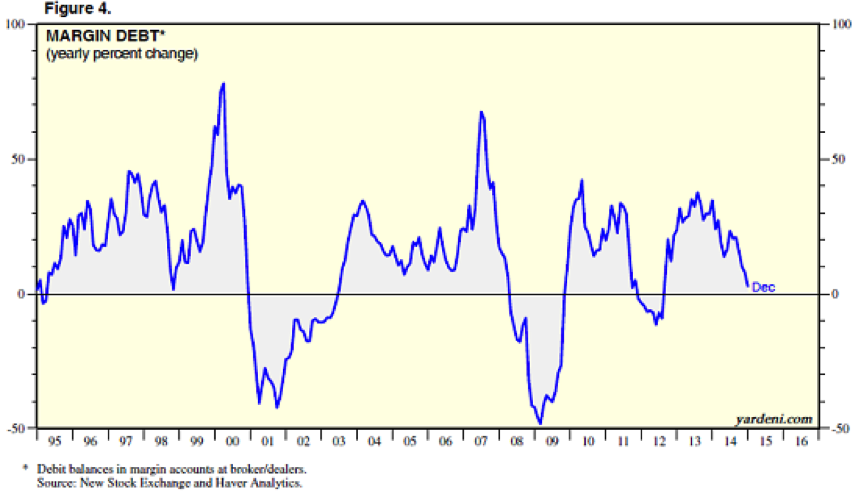
Moreover, after roaring to a new high, margin debt is rolling over, too — a sign that the raw fuel needed to push stocks higher is running out. In the recent past, these turns have been associated with stock market pullbacks of 20 percent, or outright bear markets.
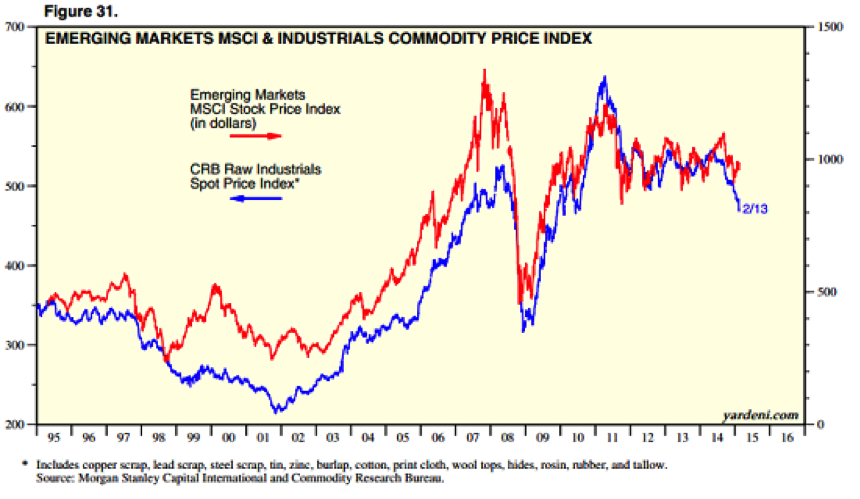
If U.S. stocks are vulnerable, the same is true of emerging market shares, given the weakness in China and the pullback in commodity prices. The relationship, highlighted by Yardeni Research in the chart below, suggests the MSCI Emerging Markets Index could drop out of its five-year trading range.
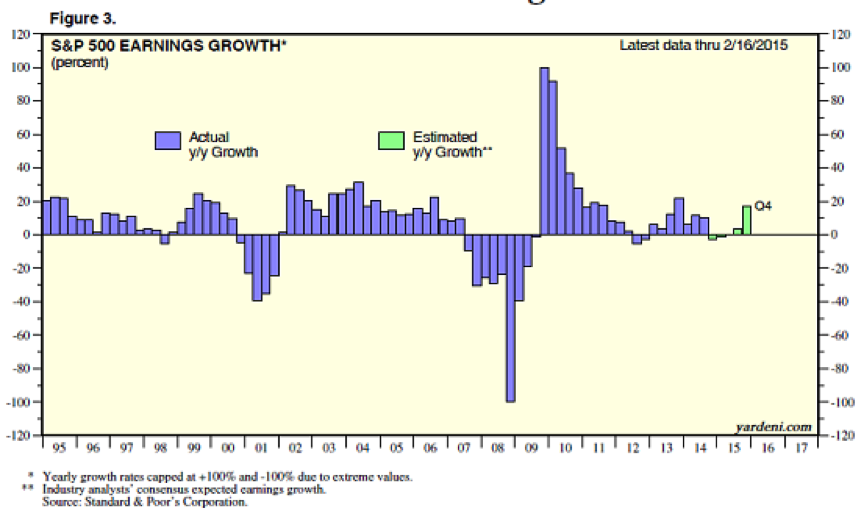
And finally, in a classic example of how hope springs eternal, all of this is being dismissed. Everyone is still looking for earnings growth to bounce back later this year to levels not seen since 2013.
I could keep going. But I think you get the idea.
With the market historically having a tough time in the second half of February, I think we could be in for a violent retest of recent lows as the bubble of enthusiasm in stocks is popped by any number of these factors hitting home — not to mention the dynamic situations that remain in play in Greece and Ukraine.
Plan accordingly and resist the urge to top-tick this market.
Top Reads from The Fiscal Times:
- How Wall Street is Fighting to Rip Off Your Retirement Money
- Americans Are About to Get a Nice Fat Pay Raise
- 10 Facts the IRS Doesn't Want You to Know


