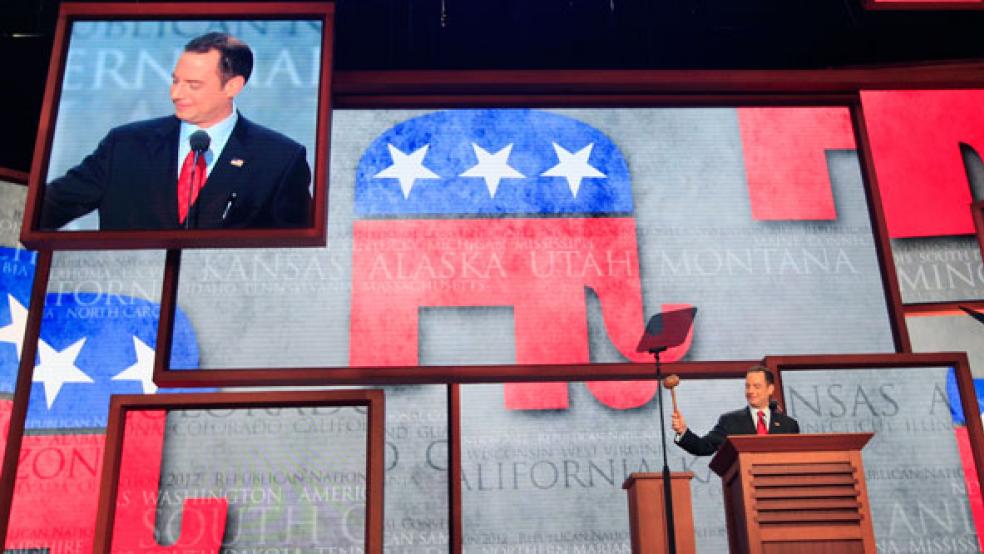
Brokers and bankers may be backing Mitt Romney in his race against President Obama, but as Republicans start their Tampa nominating convention in earnest, will three days of pro-Romney tributes put investors in a bullish mood?

The stock market advanced slightly on Tuesday after posting small losses in quiet trading on Monday, when Republicans gaveled open their convention and quickly adjourned for the day because of the storm bearing down on the Gulf Coast. But if history is any guide, the market reaction to Romney’s nominating party may stay muted.
Presidential candidates typically get a significant bump in the polls as a result of their party conventions, packed as they are with hours of praise for the nominee and red meat for the party rank and file. (The Romney camp has reportedly been downplaying expectations for a bump because of the impending landfall of Hurricane Isaac.)
But the stock market historically hasn’t moved much during the Republican National Convention, even though conventional wisdom holds that Wall Street favors fiscally conservative Republicans. Stocks have tended to inch just a bit higher, overall, over the course of 16 GOP conventions dating back to the middle of last century. “Data since 1948 indicate that the S&P 500 did indeed perform better during and after Republican Conventions, but not necessarily as a result of them,” Sam Stovall, the chief equity strategist at Standard & Poor’s Capital IQ wrote in a research note last week. The S&P 500 rose during nine of the 16 Republican conventions since 1948, with a median gain of 0.32 percent across all the gatherings. Stocks fell during nine of the 16 Democratic confabs, with a median loss of 0.23 percent.
S&P 500 Performances During | ||||||
| Year | Candidate | Dates | During | After | ||
| 1948 | Dewey/Warren | 6/21-6/25 | 0.24 | 0.12 | ||
| 1952 | Eisenhower/Nixon | 7/7-7/11 | 0.04 | -0.52 | ||
| 1956 | Eisenhower/Nixon | 8/20-8/23 | -0.52 | -2.21 | ||
| 1960 | Nixon/Lodge | 7/25-7/28 | 0.72 | 0.59 | ||
| 1964 | Goldwater/Miller | 7/13-7/16 | 0.4 | -0.19 | ||
| 1968 | Nixon/Agnew | 8/5-8/8 | 0.2 | 1.69 | ||
| 1972 | Nixon/Agnew | 8/21-8/23 | 0.48 | -1.52 | ||
| 1976 | Ford/Dole | 8/16-8/19 | -1 | -2 | ||
| 1980 | Reagan/Bush | 7/14-7/17 | 1.19 | 0.29 | ||
| 1984 | Reagan/Bush | 8/20-8/23 | 1.32 | -0.31 | ||
| 1988 | Bush/Quayle | 8/15-8/18 | 0.9 | -0.71 | ||
| 1992 | Bush/Quayle | 8/17-8/20 | -0.59 | -1.13 | ||
| 1996 | Dole/Kemp | 8/12-8/15 | -0.52 | 1.27 | ||
| 2000 | Bush/Cheney | 7/31-8/3 | 1.52 | 0.53 | ||
| 2004 | Bush/Cheney | 8/30-9/2 | 1.74 | 0.5 | ||
| 2008 | McCain/Palin | 9/1-9/4 | -3.59 | 0.99 | ||
| Median | 0.32 | -0.04 | ||||
| Source: S&P Capital IQ | ||||||


