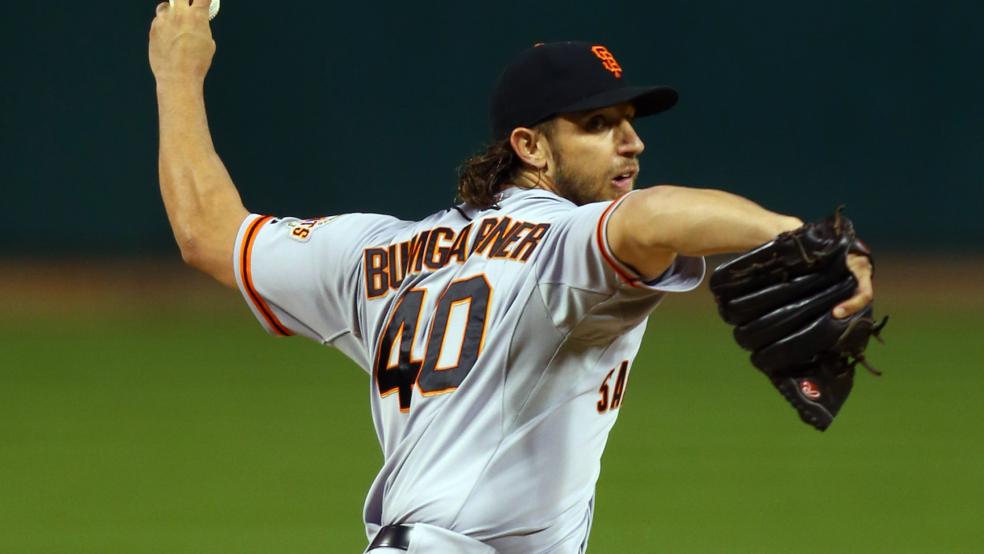
The Kansas City Royals last made the World Series in 1985, four years before San Francisco Giants pitcher Madison Bumgarner was born. Yet when Bumgarner took the mound in Game 1 of the 2014 Fall Classic this past Tuesday, it was the precocious left-hander who had experience on his side. In his first four seasons, Bumgarner had been a World Series starter twice. Both times, in 2010 and 2012, he held his opponent scoreless en route to a Giants victory.
Much to the Royals’ chagrin, Tuesday followed the familiar script. Seven innings. Three hits. One run. Giants win.
At just 25, Bumgarner has two championship rings, and a chance to earn a third. He’s an all-star, and the ace of a pitching staff full of former Cy Young winners.
But his salary? Only $3.75 million. Not peanuts, but a far cry from fellow Giants starters Matt Cain ($20 million), Tim Lincecum ($17 million), and Jake Peavy ($14.5 million).
Related: MLB’s Real All-Stars: Which Teams Have Spent Their Money Best in 2014?
Not that this pay disparity should be surprising. Though it may not be obvious to the casual fan, underpaid youth are as much a part of baseball as seventh-inning stretches and arguing with umpires.
Like many workplaces, baseball has a salary scale that rewards seniority. Players can’t become free agents until they’ve played six seasons, which gives teams monopoly power. As a result, almost all young players, however talented, are paid near the league minimum (currently $500,000). After three seasons, salary arbitration can provide a bump, but wages generally remain below market rates.
That’s been changing some in recent years, especially as smaller-market teams look to sign their best players to long-term contracts early in their careers, sometimes even before they’ve become eligible for arbitration. The Los Angeles Angels of Anaheim earlier this year signed young superstar Mike Trout to a six-year, $144.5 million contract, offering him a healthy pay increase to get him to postpone his free agency by three years. The Houston Astros threw the industry a curveball in June by signing 22-year-old prospect Jonathan Singleton to a five-year contract extension that guarantees him at least $10 million and could be worth up to $35 million — before Singleton had even made his Major League debut.
Even so, most top youth continue to receive artificially low wages during their early years — some of which may be their most productive.
When free agency comes, however, it comes big. Stars sign supersized contracts — the value of which is often not matched by their subsequent on-field performances.
Consider the aforementioned Lincecum, who earned a total of $1 million for the back-to-back Cy Young seasons he produced in 2008 and 2009, before his 26th birthday. We can quantify his performance by saying he produced an average of 7.7 “wins above replacement,” or WAR, during those seasons. As you might imagine, calculating WAR is a bit involved, but basically it means that without Lincecum, the Giants would have won about eight fewer games each year. Eight wins for one player is huge. In 2014, just nine wins separated the Giants from — gasp! — the New York Mets.
With free agency on the horizon, Lincecum didn’t stay underpaid for long. Between 2012 to 2014, the Giants paid Lincecum a cool $57 million. What wasn’t so cool was his WAR, which totaled -3.0 during that span. That’s right: during the last three seasons, the Giants would have been more successful without his highly paid right arm.
Related: Why A-Rod Is Still Rolling in the Dough
Lincecum is not an exception. The asymmetry between productivity and pay over the age cycle — perform when young, get paid when old — is the norm in baseball.
Take the 2013 season. As the graph below shows, the youngest players, on average, were the most successful. Performance hit a second peak around 30, then fell off rather sharply. By contrast, earnings rose uniformly with age, peaking in the late-30s.

Said differently, all players 27 and under accounted for 44 percent of wins, but just 15 percent of salary. For the 33-plus set, the situation was the opposite: 17 percent of wins and 37 percent of costs.

The system is like this by design, justified as a way to keep small-market teams competitive (and influential veterans in the player’s union happy). But there are good reasons to believe age-based inequality imposes considerable costs in terms of fairness and efficiency.
Related: Which Three Home Run Derby Contestants Make Less Than $1 Million?
An economist’s definition of efficient compensation is that you are paid equal to the value you produce. To test whether baseball meets this standard, I examined the careers of players who entered the majors between 1985 and 1995 and retired by 2014. Players produce wins. I set the value of a win in each season equal to league total payroll divided by league total WAR. (In 2013, for example, the value of a win, or more accurately the average expenditure per WAR, was $3.3 million.) The compensation scheme is efficient if, on average, players’ career earnings match their career value created. A positive player surplus means a player received outsized compensation during his career, while a deficit means his team was the financial winner.
The table below shows the results by performance decile (i.e., players who rank in the top 10 percent in average WAR for their careers are in the tenth decile).
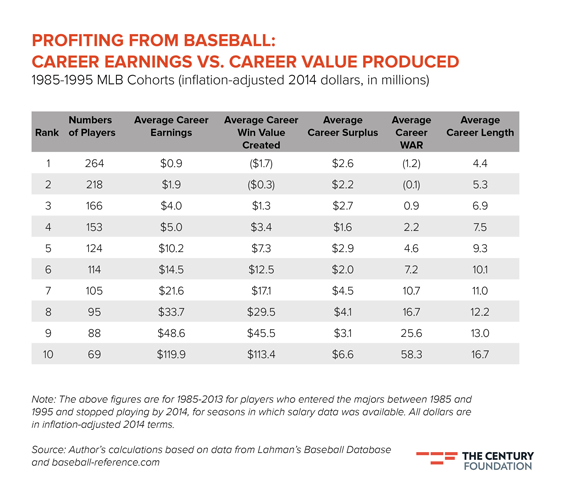
A few findings stand out. First, on average, players earn about what they produce (given that my win value estimates are rough, a modest player surplus is consistent with efficiency). The best players earn a lot more than average players, but they also produce a lot more value for their teams. Indeed, there is some evidence (in the form of greater surpluses) that top players receive a modest premium.
Where the efficiency argument breaks down is when you realize even the worst players “earn” decent surpluses, in some cases by producing negative value for their teams. At the same time, by virtue of the huge win values they create early in their careers, top players need to have long careers if they are to “break-even.” By my calculations, players in the top 10 percent enter positive territory only in their late 30s. Compare that to middling players who need play only a decade or so to achieve the same feat.
Related: The NFL’s Fantastic Finances — 14 Surprising Stats
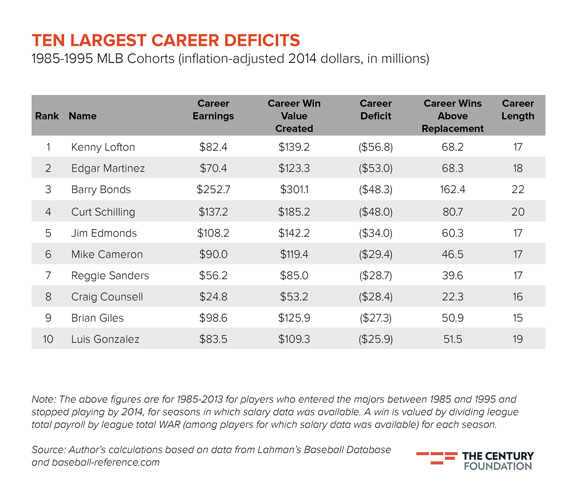
Even more problematic, the aggregate trends disguise considerable variation in individual player experiences. Players with the largest career deficits—that is, who produced way more for their teams than they received in pay—are uniformly superstars. Kenny Lofton “leads” the pack at -$57 million. Barry Bonds is third at -$48 million. Lofton’s deficit is attributable to never having been awarded a large, long-term contract. Bonds, on the other hand, is victim of his own alleged use of performance-enhancing drugs: He was extraordinarily productive for a very long time. Because his performance never declined with age, he never experienced the high-pay-for-low-performance period most top players do.
Stars also reap some of the largest surpluses. At the top of the list, Gary Sheffield generated an $85 million surplus, with his $219 million in earnings far exceeding his $134 million win value. Sheffield was a very good player, yes, but did he really deserve the sweetest deal of his generation? (I also include Alex Rodriguez in the list with an asterisk because he entered the majors in 1994 and did not play in 2014, which meets my sample selection criteria.)
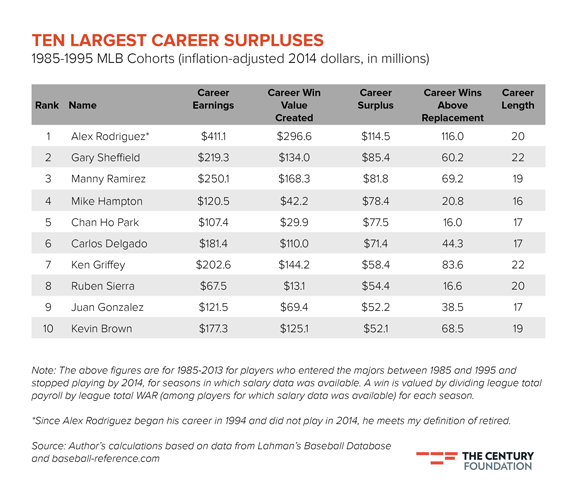
Just below him, things get even murkier. Mike Hampton and Chan Ho Park each reaped surpluses of $78 million. Both had a handful of good seasons before inking huge contracts, then proceeded to be basically terrible. Beyond them, the portrait is similar: many good players, a few greats, and a disconcerting number of average ones.
In theory, “play now, get paid later” can even out in the long run: Players just have to stay patient, committed, and healthy. In reality, though, many players fail to break even. Hitting the jackpot is mostly about good luck.
These perverse situations — overpaying mediocre players and underpaying great ones — could be avoided if baseball eliminated the temporal disconnect between performance and pay. My data also suggests baseball’s lopsided compensation system deprives money of its incentivizing value. Indeed, players (and especially older players) tend to perform worse after signing large contracts, though the impact is difficult to disentangle from the effects of aging and simple mean reversion (i.e., great seasons are invariably followed by less great ones).
As it stands, compensation in baseball is neither efficient nor fair.
Mike Cassidy is a policy associate at The Century Foundation.
Top Reads from The Fiscal Times:
- 9 Sports Superstars You’ve Never Heard Of
- Who’s More Generous, Liberals or Conservatives?
- Startling Proof That the Music Industry Is Doomed


