Can Anyone Stop the $38 Billion Airline Fee Squeeze?
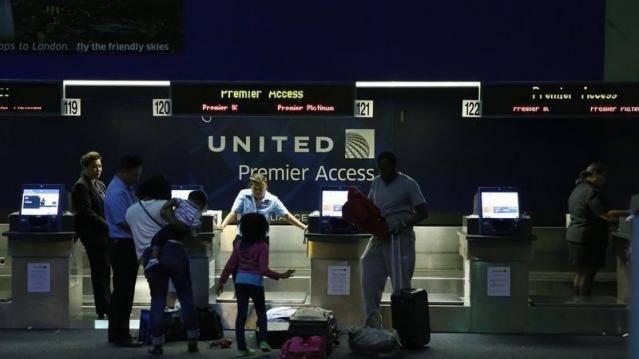
U.S. airlines earned $2.6 billion in fees and frequent flier mile sales in 2014, an 18.7 percent increase from 2013, according to an annual report by consultancies IdeaWorks and CarTrawler.
That represents the eighth consecutive year that carriers saw substantial revenue ancillary to ticket sales. Globally, ancillary revenue soared more than 20 percent to $38.1 billion.
“Ancillary revenue is an increasingly important indicator of commercial success, and a major contributor to the bottom line of airlines across the globe,” said Michael Cunningham, CarTrawler’s Chief Commercial Officer, in a statement.
Related: 6 Sneaky Fees that Are Making Airlines a Bundle
By passenger, additional revenue grew by 8.5 percent to $17.49. Low cost carriers increased ancillary revenue by 32.8 percent for the year, or $2.9 billion.
Ten airlines earned two-thirds of the ancillary revenue, led by United Airlines, American/U.S. Airways, and Delta. Delta brought in $350 million through its Comfort Plus program, which allows passengers to pay extra for more legroom and priority boarding.
Among passengers’ most hated fees are checked bag fees. Airlines typically charge $25 for the first bag, $35 for the second, and more than $100 for a third bag.
As frequent fliers turn to branded credit cards as a means of avoiding fees, airlines are still earning money. Last year, American’s Citibank-issued credit card, which gives consumers one free checked bag and priority boarding, yielded an additional $624 million for the carrier last year.
The additional fees are not improving the customer experience. More than 60 percent of consumers surveyed by the U.S. Travel Association in March said they were frustrated with air travel generally.
Chart of the Day: Boosting Corporate Tax Revenues
The leading candidates for the Democratic presidential nomination have all proposed increasing taxes on corporations, including raising income tax rates to levels ranging from 25% to 35%, up from the current 21% imposed by the Republican tax cuts in 2017. With Bernie Sanders leading the way at $3.9 trillion, here’s how much revenue the higher proposed corporate taxes, along with additional proposed surtaxes and reduced tax breaks, would generate over a decade, according to calculations by the right-leaning Tax Foundation, highlighted Wednesday by Bloomberg News.
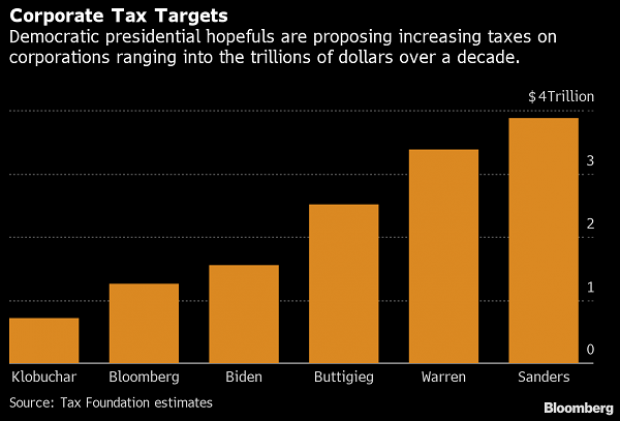
Chart of the Day: Discretionary Spending Droops
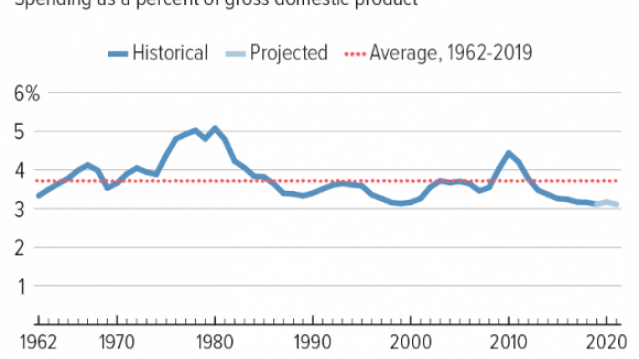
The federal government’s total non-defense discretionary spending – which covers everything from education and national parks to veterans’ medical care and low-income housing assistance – equals 3.2% of GDP in 2020, near historic lows going back to 1962, according to an analysis this week from the Center on Budget and Policy Priorities.
Chart of the Week: Trump Adds $4.7 Trillion in Debt
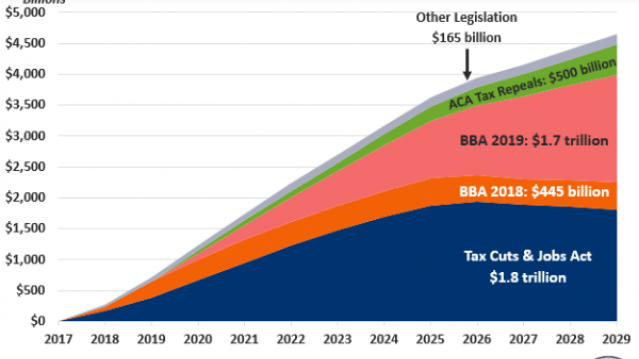
The Committee for a Responsible Federal Budget estimated this week that President Trump has now signed legislation that will add a total of $4.7 trillion to the national debt between 2017 and 2029. Tax cuts and spending increases account for similar portions of the projected increase, though if the individual tax cuts in the 2017 Republican overhaul are extended beyond their current expiration date at the end of 2025, they would add another $1 trillion in debt through 2029.
Chart of the Day: The Long Decline in Interest Rates

Are interest rates destined to move higher, increasing the cost of private and public debt? While many experts believe that higher rates are all but inevitable, historian Paul Schmelzing argues that today’s low-interest environment is consistent with a long-term trend stretching back 600 years.
The chart “shows a clear historical downtrend, with rates falling about 1% every 60 years to near zero today,” says Bloomberg’s Aaron Brown. “Rates do tend to revert to a mean, but that mean seems to be declining.”
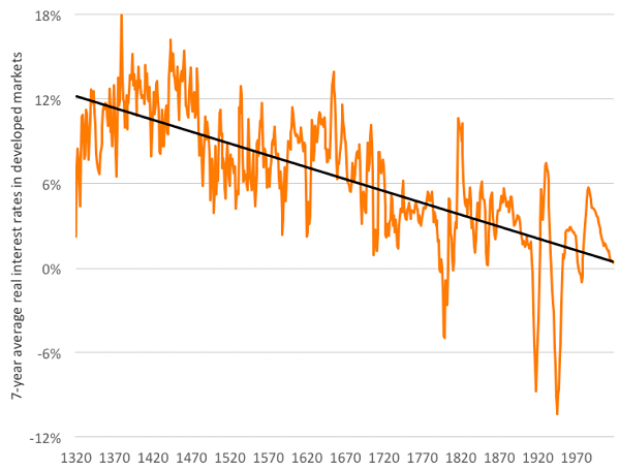
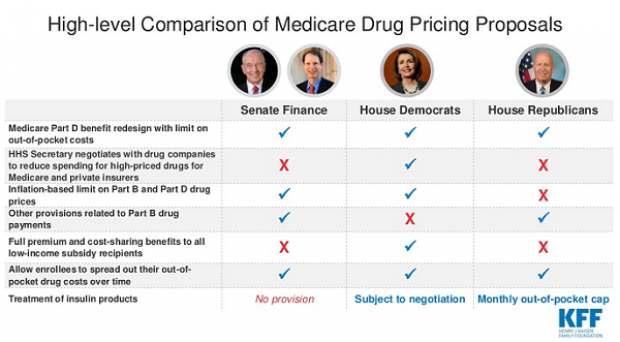
Chart of the Day: Drug Price Plans Compared
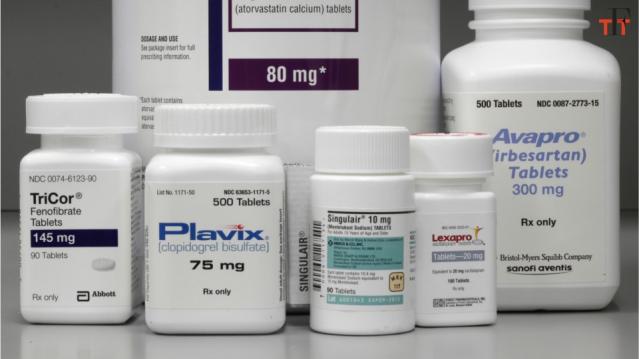
Lawmakers are considering three separate bills that are intended to reduce the cost of prescription drugs. Here’s an overview of the proposals, from a series of charts produced by the Kaiser Family Foundation this week. An interesting detail highlighted in another chart: 88% of voters – including 92% of Democrats and 85% of Republicans – want to give the government the power to negotiate prices with drug companies.
