This Is What America’s 'Dream Home' Looks Like

The dream home for today’s American consumer is just over 2,000 square feet and located outside of a major city, according to a report out today by Trulia.
Consumers polled by the real estate Web site said the top features in their dream home were a backyard deck, a gourmet kitchen, and an open floorplan.
Owning a home is still part of the American dream for 70 percent of those polled, down from 77 percent five years ago. The portion of Americans who want to buy a home one day was highest—hitting almost 90 percent—among millennials.
Related: 10 Luxury Home Amenities that Are Trending Up
Those findings echo the results of a Wells Fargo poll in June, which found that nearly two-thirds of consumers say that home ownership is a “dream come true” and an accomplishment to be proud of.
Despite the desire for home ownership, only 14 percent of those surveyed by Trulia said they would buy a home this year. Nearly 70 percent said they planned on waiting at least two years to make a purchase.
The country’s home ownership rate fell to 63.7 percent in the first quarter, the lowest level since 1989. The rate peaked at 69.2 percent in the fourth quarter of 2004, right before the housing bubble burst.
Just 36 percent of millennials who want to buy a home are currently saving to purchase one. As rents in many cities continue to skyrocket, however, homeownership may become more appealing.
- The 10 Fastest-Growing Jobs Right Now
- Teens Are Having Much Less Sex Than Their Parents Did at That Age
- 9 Social Security Tips You Need to Know Right Now
Chart of the Day: Boosting Corporate Tax Revenues
The leading candidates for the Democratic presidential nomination have all proposed increasing taxes on corporations, including raising income tax rates to levels ranging from 25% to 35%, up from the current 21% imposed by the Republican tax cuts in 2017. With Bernie Sanders leading the way at $3.9 trillion, here’s how much revenue the higher proposed corporate taxes, along with additional proposed surtaxes and reduced tax breaks, would generate over a decade, according to calculations by the right-leaning Tax Foundation, highlighted Wednesday by Bloomberg News.
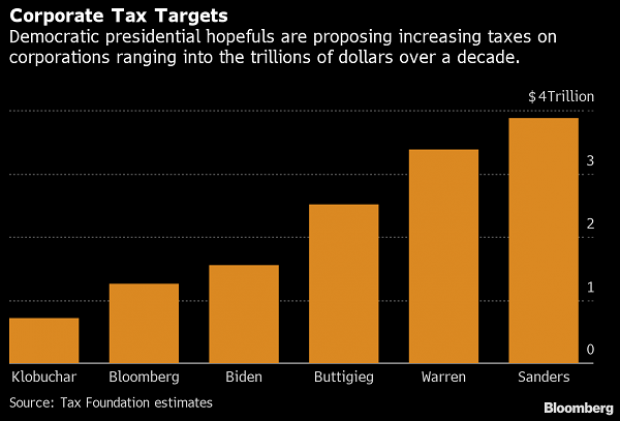
Chart of the Day: Discretionary Spending Droops
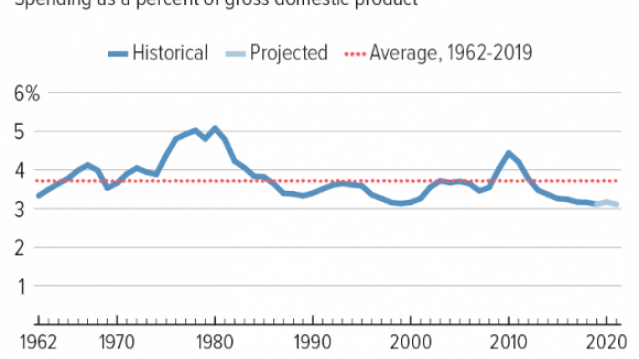
The federal government’s total non-defense discretionary spending – which covers everything from education and national parks to veterans’ medical care and low-income housing assistance – equals 3.2% of GDP in 2020, near historic lows going back to 1962, according to an analysis this week from the Center on Budget and Policy Priorities.
Chart of the Week: Trump Adds $4.7 Trillion in Debt
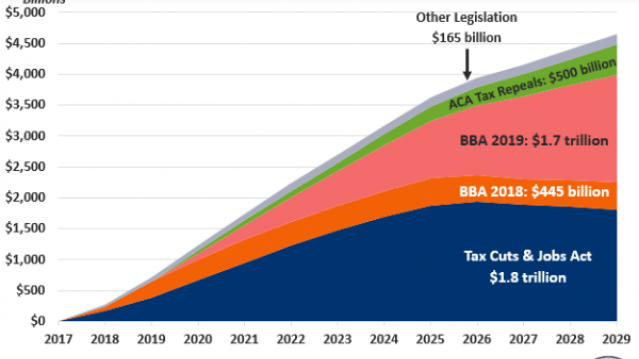
The Committee for a Responsible Federal Budget estimated this week that President Trump has now signed legislation that will add a total of $4.7 trillion to the national debt between 2017 and 2029. Tax cuts and spending increases account for similar portions of the projected increase, though if the individual tax cuts in the 2017 Republican overhaul are extended beyond their current expiration date at the end of 2025, they would add another $1 trillion in debt through 2029.
Chart of the Day: The Long Decline in Interest Rates

Are interest rates destined to move higher, increasing the cost of private and public debt? While many experts believe that higher rates are all but inevitable, historian Paul Schmelzing argues that today’s low-interest environment is consistent with a long-term trend stretching back 600 years.
The chart “shows a clear historical downtrend, with rates falling about 1% every 60 years to near zero today,” says Bloomberg’s Aaron Brown. “Rates do tend to revert to a mean, but that mean seems to be declining.”
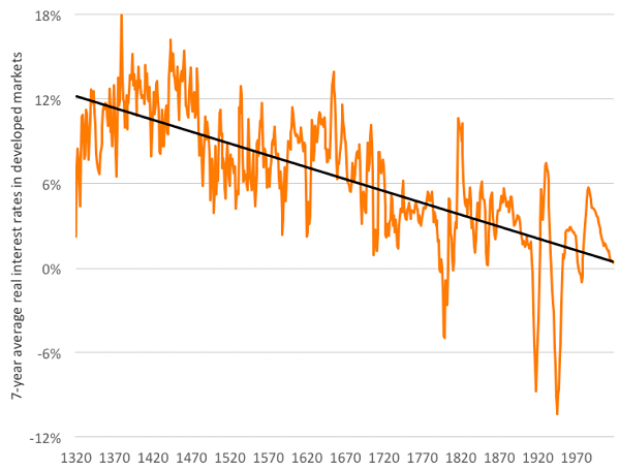
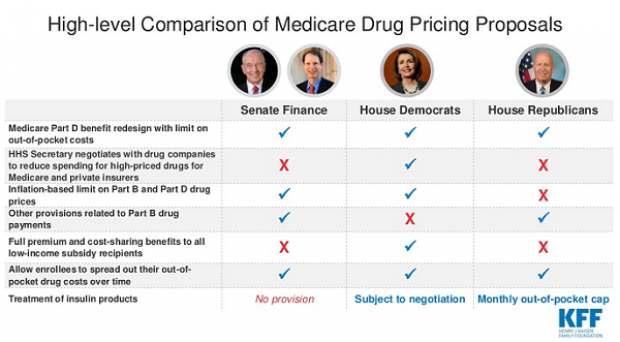
Chart of the Day: Drug Price Plans Compared
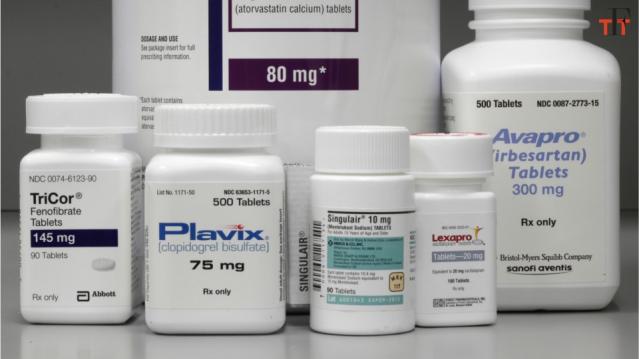
Lawmakers are considering three separate bills that are intended to reduce the cost of prescription drugs. Here’s an overview of the proposals, from a series of charts produced by the Kaiser Family Foundation this week. An interesting detail highlighted in another chart: 88% of voters – including 92% of Democrats and 85% of Republicans – want to give the government the power to negotiate prices with drug companies.
