
The U.S. labor market has undergone huge changes in recent years. Unemployment has swung from a low of 3.8 percent in April 2000 to 10 percent at the height of the Great Recession and back down to 6.3 percent as of last month. The percentage of Americans ages 16 and older with jobs has plunged, from above 64 percent in 2000 to below 59 percent. And the shifting economy has led to big swings in employment across key sectors.
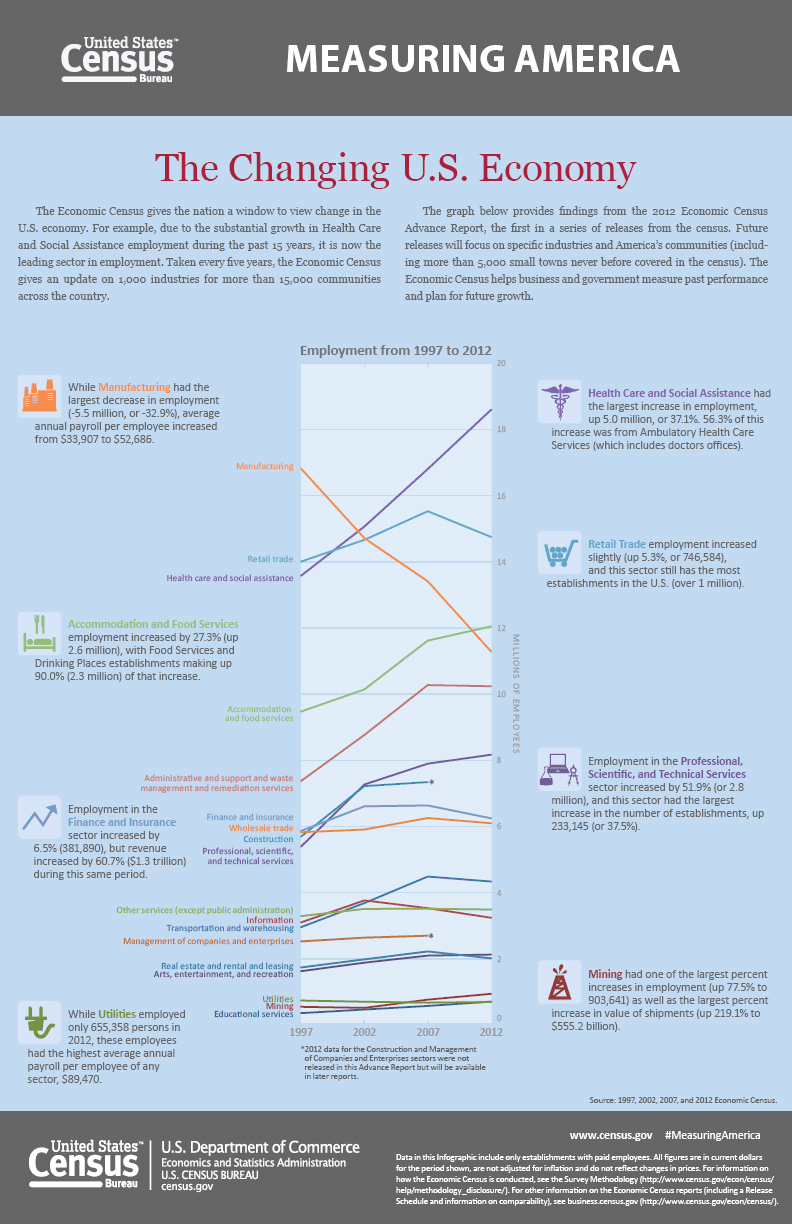
This new chart, put together by the U.S. Census Bureau based on its economic census between 1997 and 2012, shows how those changes have played out.
Related: Spending on Infrastructure Now Generates Long-Term Jobs Later
Remember, in 1997 Bill Clinton was inaugurated for his second term, the Internet economy was in its infancy and the unemployment rate was at 4.9 percent.
In 1997, manufacturing dominated as the industry that employed the greatest number of people in the U.S, followed by retail trade, health care and social assistance, and hotels and food services, according to the Census data.
Fast forward to 2012, when the country still felt some ripple effects from the recession of 2008 and 2009 and the unemployment rate was at a whopping 8.1 percent.
Between 1997 and 2012, the largest employment growth occurred in the health care and social assistance sector, which added 5 million jobs and is now the top sector in employment. More than half of the jump was from outpatient services, including visits to doctors’ offices and clinics.
Meanwhile, manufacturing saw the largest decrease in employment, with a loss of some 5.5 million jobs, a plunge of 32.9 percent. At the same time, annual payroll per manufacturing employee increased to $52,686 from $33,907 before adjusting for inflation.
Here’s the Census snapshot of the changing jobs landscape:
 Click to enlarge.
Top Reads from The Fiscal Times: