
Since late July's push to new record highs, stocks have cooled a little. Some of this is due to tensions in Iraq, Ukraine, Israel and elsewhere. Some of this has been due to the volatility in the high-yield bond market. Some of this has been driven by an improving economic outlook, which counter-intuitively is a negative, since it risks bringing forward the timing of the Federal Reserve’s first interest rate hike since 2006.
Another catalyst has been the realization that stocks were more than fully priced, despite recent proclamations from Federal Reserve Chairman Janet Yellen that equity market valuations are within historic norms.
The valuation concerns also come despite the ongoing strength of corporate earnings growth: Through the end of last week, with just over 90 percent of the S&P 500 reporting second-quarter results, the blended earnings growth rate stood at 8.4 percent vs. the 4.9 percent expected at the start of the quarter.
Related: The Perfect Storm Rocking World Markets
There are a number of ways to measure stock market valuations, from the basic price-to-earnings ratio for the S&P 500 to Tobin's Q to price-to-enterprise value. The trouble with a simple P/E ratio is that both price and earnings can be quite volatile, making any determination more difficult. Yale economist Robert J. Shiller, and author of Irrational Exuberance, has looked to address this volatility by devising the cyclically adjusted price-to-earnings multiple, or CAPE, which is based on a ten-year moving average of earnings. This is designed to help give a less noisy indicator of whether stocks are overvalued or not.
Right now, his measure is at levels (nearly 26x) that have only been exceeded in the run up to market peaks in 1929, 2000 and 2007. In other words, Yellen is right in that we've seen these valuation levels before. And the bulls are also right that valuations have pushed much higher before hitting a peak near 28x in the last bull market, nearly 44x in 1999, and nearly 33x in 1929.
The problem is that history suggests when prices get this high relative to earnings the danger to investors rises precipitously. Yellen held that back. Given the expanding multiples investors are paying, the market is starting to trade beyond what's justified by the fundamentals. When the market gets this expensive, emotions play a bigger and bigger role in how high stock prices can ultimately go. This isn't exactly the most stable of foundations with which to build an investment strategy.
Is there any other valuations measure that can help us determine where we really are?
Help comes from the land down under, where Daniel J. Want, analytics director at Prerequisite Capital Management in Queensland, Australia, has taken Shiller's CAPE and further refined it (although he doesn't take original credit for the idea, saying he's forgotten where he originally saw it). As highlighted by Tom McClellan of the McClellan Market Report, Want has taken the CAPE and divided it by corporate bond yields, specifically the Moody's Baa yield.
The genius is in this is that it further trims the volatility of the CAPE and gives us an easier to understand message: By this measure, stock valuations have returned to heights associated with major market peaks:
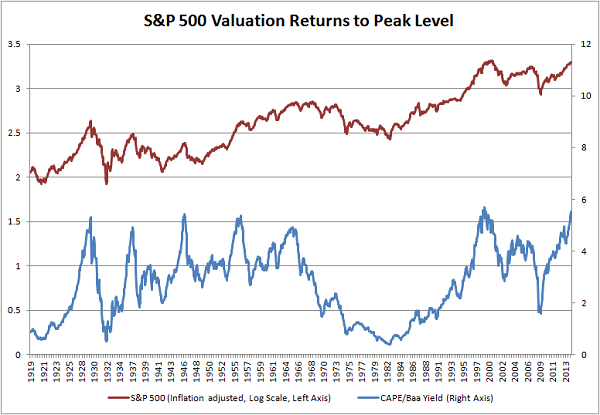
In McClellan's words, the magic of the modified CAPE/Baa ratio is that it "seems to set a much more uniform ceiling for how high valuations can go." He adds that when it gets above a certain level the indicator says the market "is really getting to the edge, and is near a major price top." He emphasizes that this may not be an immediate problem, since the message is that we're near a major top; not necessarily at one.
Related: The U.S. Economy Is Finally Catching Fire
So, what should investors look for as the final warning sign? A close study of the chart above reveals that stock market tops either coincide or come slightly after the final peaks in the CAPE/Baa ratio. McClellan likens the ratio to a rubber band, expanding and compressing but never going in one direction for too long. And right now, he sees the rubber band as "getting stretched really far, and that is a problem for the really long run for stock prices."
More simply, while the economy is revving up and the risk of a recession is remote, it appears that the stock market's gains for this cycle are pretty much been fully baked in.
Top Reads from The Fiscal Times:
- 12 Jobs We’re Losing to Robots
- The Eurozone’s So-Called Recovery Is a Bust
- Why GDP Grows More Under Democratic Presidents