6.6M Homes at Risk of Hurricane Damage This Year. Here’s Which States They’re In
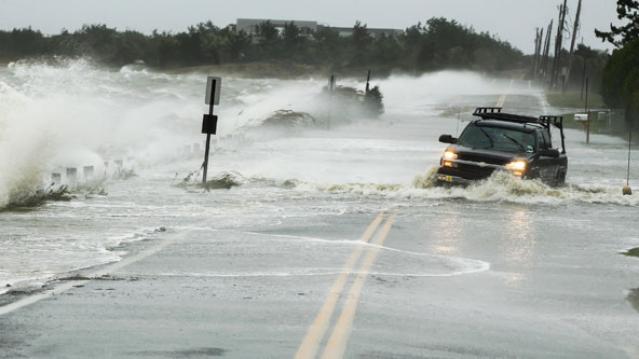
As hurricane season gets underway, real estate analytics firm CoreLogic is warning that there are more than 6.6 million U.S. homes at risk of being hit by a storm surge. That could lead to as much at $1.5 trillion in damage.
The homes are in 19 states and the District of Columbia along the Atlantic and Gulf Coasts. Six states account for more than three-quarters of all at-risk homes, with Florida having the most (2.5 million), followed by Louisiana (760,000), New York (465,000), New Jersey (446,148), Texas (441,304) and Virginia (420,052).
Related: How Climate Change Costs Could Soar to the Billions
“The number of hurricanes each year is less important than the location of where the next hurricane will come ashore,” CoreLogic’s senior hazard risk analyst said in a statement. “It only takes one hurricane that pushes storm surge into a major metropolitan area for the damage to tally in the billions of dollars. With new home construction, and any amount of sea-level rise, the number of homes at risk of storm surge damage will continue to increase.”
The District of Columbia has the lowest number of properties at risk (3,700), followed by New Hampshire (12,400) and Maine (22,500
State Table (Ranked by Number of Homes at Risk)
|
Rank |
State |
Extreme |
Very High |
High |
Moderate |
Low* |
Total |
|
1 |
Florida |
793,204 |
461,632 |
524,923 |
352,102 |
377,951 |
2,509,812 |
|
2 |
Louisiana |
97,760 |
104,059 |
337,495 |
138,762 |
82,196 |
760,272 |
|
3 |
New York |
127,325 |
114,876 |
131,039 |
91,294 |
N/A |
464,534 |
|
4 |
New Jersey |
116,581 |
178,668 |
73,303 |
77,596 |
N/A |
446,148 |
|
5 |
Texas |
45,800 |
70,894 |
112,189 |
116,168 |
96,253 |
441,304 |
|
6 |
Virginia |
94,260 |
115,770 |
98,463 |
84,015 |
27,544 |
420,052 |
|
7 |
South Carolina |
107,443 |
57,327 |
65,885 |
46,799 |
30,961 |
308,415 |
|
8 |
North Carolina |
73,463 |
51,927 |
48,595 |
40,155 |
37,347 |
251,487 |
|
9 |
Massachusetts |
31,420 |
65,279 |
74,413 |
49,325 |
N/A |
220,437 |
|
10 |
Maryland |
47,990 |
39,966 |
27,591 |
28,975 |
N/A |
144,522 |
|
11 |
Georgia |
41,970 |
52,281 |
28,852 |
19,190 |
8,465 |
150,758 |
|
12 |
Pennsylvania |
1,467 |
45,776 |
37,983 |
32,426 |
N/A |
117,652 |
|
13 |
Mississippi |
14,809 |
20,643 |
29,387 |
27,507 |
10,588 |
102,934 |
|
14 |
Connecticut |
25,292 |
23,656 |
22,230 |
26,529 |
N/A |
97,707 |
|
15 |
Alabama |
7,403 |
12,707 |
10,182 |
13,749 |
14,086 |
58,127 |
|
16 |
Delaware |
11,523 |
10,854 |
13,528 |
13,811 |
N/A |
49,716 |
|
17 |
Rhode Island |
6,595 |
5,988 |
6,720 |
7,187 |
N/A |
26,490 |
|
18 |
Maine |
5,159 |
2,753 |
7,368 |
7,211 |
N/A |
22,491 |
|
19 |
New Hampshire |
2,514 |
3,470 |
4,234 |
2,272 |
N/A |
12,490 |
|
20 |
District of Columbia |
N/A** |
N/A** |
545 |
3,123 |
N/A |
3,668 |
|
Total |
1,651,978 |
1,438,526 |
1,654,925 |
1,178,196 |
685,391 |
6,609,016 |
* The "Low" risk category is based on Category 5 hurricanes, which are not likely along the northeastern Atlantic coast. States in that area have N/A designated for the Low category due to the extremely low probability of a Category 5 storm affecting that area.
** Washington, D.C. has no Atlantic coastal properties, but can be affected by larger hurricanes that push storm surge into the Potomac River. Category 1 and 2 storms will likely not generate sufficient storm surge to affect properties in Washington, D.C.
6 Traits of an Emerging Millionaire: Are You One?

It’s not just Wall Street bankers, hedge fund traders and corporate raiders who will join the one percent. Nope. By now you may have heard that the new look of affluence in America is kind of… girly. The 7th Fidelity Millionaire Outlook found that today’s emerging high rollers are 66 percent female and 25 percent non-white.
The Fidelity Outlook identified 6 wealth-building traits that multi-millionaires have in common: Their starting point—a mere $250,000 in assets.
Related: Americans Are About to Get a Nice Fat Pay Raise
1 Time Horizon: On average, emerging affluent investors are just 40 years of age with 27 years left before they reach the normal retirement age of 67. Only one percent of the emerging affluent is retired.
2. Career: Many of the emerging affluent have pursued similar professions to today’s millionaires, including information technology, finance and accounting. While they might be at lower-level positions than millionaires, they have a number of years in front of them to move up the ladder.
3. Income: At $125,000, the median annual household income for the emerging affluent is 2.5X the median U.S. household income8 and is nearing the income of today’s millionaires ($200,000 for those still employed).
Related: The 10 Best States for Taxes in 2015
4. Self-Made Status: Approximately eight in 10 emerging affluent investors have earned or increased their assets on their own, a trait they share with millionaires and deca-millionaires.
5. Long-Term Focus: The emerging affluent share millionaires’ long-term focus, with three in four of both groups focused on the long-term growth of their assets, and three in 10 focused on supporting the lifestyle they want in retirement.
6. Investing Style: Similar to deca-millionaires, the emerging affluent display a willingness to invest aggressively to help maximize returns, as well as a willingness to set aside a significant portion of their portfolio for riskier investments that promise a bigger payoff. The emerging affluent and deca-millionaires were also most likely to describe themselves as “self-directed” investors, seeking hands-on involvement with their investments.
Top Reads from The Fiscal Times:
- The 10 Worst States For Paying Taxes
- 6 Popular Social Security Myths Busted
- The Worst States For Retirement in 2015
Why Hard Science and Medicine Is Getting Mushy

Arthur Caplan, one of America’s top medical ethicists, is worried about pollution. Not the kind that ruins our oceans or makes it hard for us to breathe, but the kind that poses a threat to the “trustworthiness, utility, and value of science and medicine.”
Caplan, who directs the Division of Medical Ethics at NYU Langone Medical Center, wrote a blistering essay in last week’s Mayo Clinic Proceedings, saying, "The pollution of science and medicine by plagiarism, fraud, and predatory publishing is corroding the reliability of research. Yet neither the leadership nor those who rely on the truth of science and medicine are sounding the alarm loudly or moving to fix the problem with appropriate energy."
He goes on to cite three causes of publication pollution, which can undermine these areas of “hard science” that should be sacrosanct.
- The proliferation of journals that recruit authors who pay to get their articles published. Despite having substandard or no peer view, these "predatory publishers" now comprise an estimated 25 percent of all open-access journals. "Not only do they provide opportunities for the unscrupulous in academia and industry to pad their curriculum vitaes and bibliographies with bogus articles and editorial appointments, they also make it difficult for those involved in the assessment and promotion of scholars to discern value from junk," writes Dr. Caplan.
- Research misconduct, like falsifying or fabricating data or concealing serious violations. Fourteen percent of scientists report that their colleagues falsify data, and 72 percent report other questionable practices, according to one 2009 study published in PLoS One.
- Plagiarism, which, according to a 2010 Nature article was "staggering," requiring editors to spend "inordinate amounts of time" checking submissions they receive.
Top Reads from The Fiscal Times:
- The Biggest Outrage in Atlanta’s Crazy Teacher Cheating Case
- $45 Billion in Tax Dollars Goes Missing in Afghanistan
- How Dark Money Is Distorting Politics and Undermining Democracy
TSA Made $674,841 from Travelers’ Loose Change Last Year
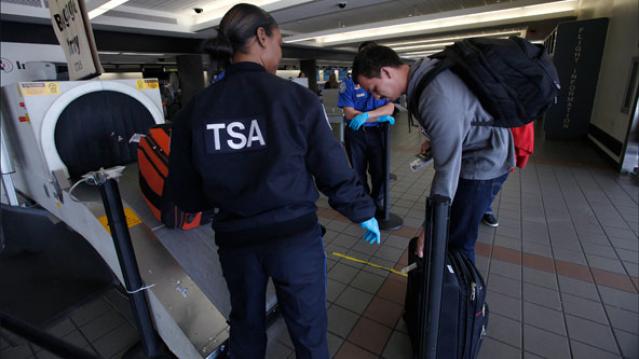
That loose change in your pocket really adds up…for the government: The Transportation Security Administration collected $674,841.06 in quarters, nickels, dimes and pennies left behind by busy travelers at airport security in fiscal 2014.
In 2005, Congress allowed the TSA to put unclaimed money toward its security operations. The agency says it “makes every effort to reunite passengers with items left behind at the checkpoint, however there are instances where loose change or other items are left behind and unclaimed.” That money is turned into the TSA’s financial office.
Related: 10 Outrageous Items Confiscated by the TSA in 2014
The amount collected has been climbing each year since 2010. The 2014 total is almost $37,000 more than the agency collected the previous year and nearly $300,000 more than was left behind in 2008. In all, over the past seven years travelers have gifted the TSA $3,557,538.39.
Yes, that’s $3.5 million in spare change the agency has added to its coffers courtesy of harried travelers.
Maybe the yearly total have been climbing because travelers are increasingly engrossed with their smartphones, or maybe it’s a sign that the economy has perked up a bit so they no longer care to scoop up those nickels and dimes. Maybe it’s just that getting through a TSA checkpoint is such a hassle that travelers are willing to donate a few coins to be done with the process several seconds sooner.
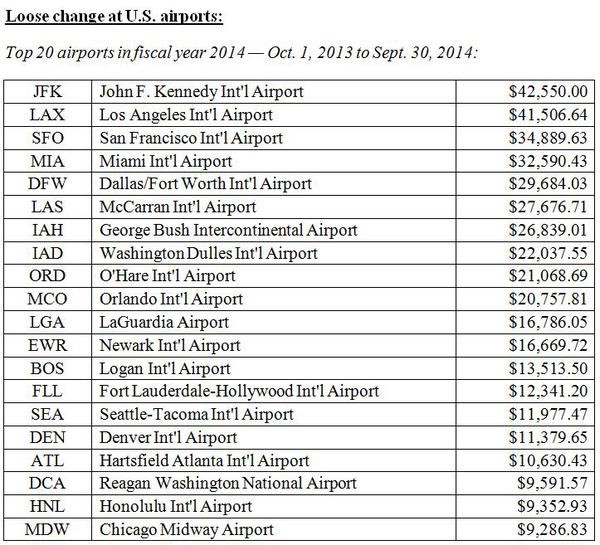
Whatever the reason, here are the 20 airports where travelers left behind the most spare change in 2014:
Top Reads from The Fiscal Times:
- It Just Got Even Cheaper to Travel Overseas
- How Many Agencies Does It Take to Change a Lightbulb?
- The Government’s $125 Billion Slap in the Face to Taxpayers
Baseball in 2015: Record High Revenues

e 2015 Major League Baseball season gets underway on Monday with the sport dealing with an aging, shrinking television audience—yet league revenues, franchise valuations and player salaries are all rising faster than the stock market.
With the average MLB team now worth more than $1.2 billion and the average salary breaking $4 million, let's take a look at how the business of baseball has changed in the last few years.
A shrinking, aging television audience
"The five most-watched World Series aired in the five-year period between 1978 and 1982," said Brad Adgate of Horizon Media. All five averaged more than 38 million viewers. Contrast that with the 2014 World Series audience—a skinny 13.8 million—down 64 percent despite an increased U.S. population. Media buyer Adgate said that's "unlike the Super Bowl, which has set an audience record in five of the last six years."
Related: Madison Bumgarner: Exhibit A in Baseball’s Screwball Salary System
Not only is the audience declining, but it's aging too: Last year's World Series had a viewer with a median age of 55.6—a new high. Just five years prior, it had been sub-50 at 49.9, and was in the 44-46 range during the early 1990s.