The Most Expensive Cities for Singles -- and the Cheapest
Looking for love in all the pricey places? Check out these lists of the most and least expensive cities for singles before you go on that next date or plan your next move. Looking good doesn’t come cheap, and the price of a decent wardrobe and a gym membership add ups before you even step out the door.
To determine which cities were the least and most affordable for singles, GoBankingRates examined 89 cities and rated them according to four expense categories -- clothing, dates, gym memberships and rent -- using data from Numbeo.com. “Singles are more likely to exercise, and to have a gym membership,” says Elyssa Kirkham, a finance writer for GoBankingRates. “They’re more likely to rent than own a home, and spend more money on dates and clothing.”
Related: Hot New Dating Criteria: What’s Your Credit Score?
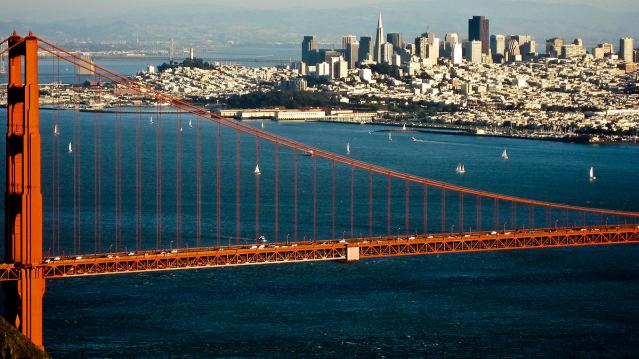
San Francisco is the most expensive city for singles, especially when it comes to rent. Rent is 30 percent more expensive in San Francisco than it is in Honolulu. The cost of a date here is $147, compared with the median cost of $109. California just might be the most expensive state to date in, claiming seven of the top 15 spots: San Francisco, Fremont, Glendale, Irvine, Los Angeles, San Diego and Oakland.
The second most expensive city? New York City, which boasts the most expensive gym membership at $90 per month. Clothing costs here are the second-highest in the nation -- bad news for all the Carrie Bradshaws out there. And date night will set you back $145.
The most expensive date night in the country is in Washington, D.C., which came in third overall. Date night in our nation’s capital costs $166 for dinner, a bottle of wine, two movie tickets and a 10-mile taxi ride. Compare that to Chattanooga, Tennessee, which had the cheapest date night at $78.
Looking for more bang for your buck? Move to Reno, Nevada. Rent here is just 86 cents per square foot, and a night out averages $97.30. Keep in mind, though, that “the Biggest Little City in the World” was once known as the divorce capital of the world, so dating there may offer less promise than other locales.
Related: The Bad News About All the Singles in America
Most Expensive Cities for Singles
- San Francisco
- New York
- Washington, D.C.
- Honolulu
- Boston
- Fremont, California
- Glendale, California
- Anchorage, Alaska
- Miami
- Seattle
- Irvine, California
- Los Angeles
- San Diego
- Oakland, California
- Madison, Wisconsin
Related: Marriage?? Young Americans Aren’t Even Shacking Up
15 Cheapest Cities for Singles
- Reno, Nevada
- Tucson, Arizona
- Grand Rapids, Michigan
- Tacoma, Washington
- Indianapolis
- Mesa, Arizona
- Little Rock, Arkansas
- Albuquerque, New Mexico
- Huntsville, Alabama
- Memphis, Tennessee
- St. Louis, Missouri
- Jackson, Mississippi
- Stockton, California
- Omaha, Nebraska
- Chattanooga, Tennessee
Chart of the Day: Boosting Corporate Tax Revenues
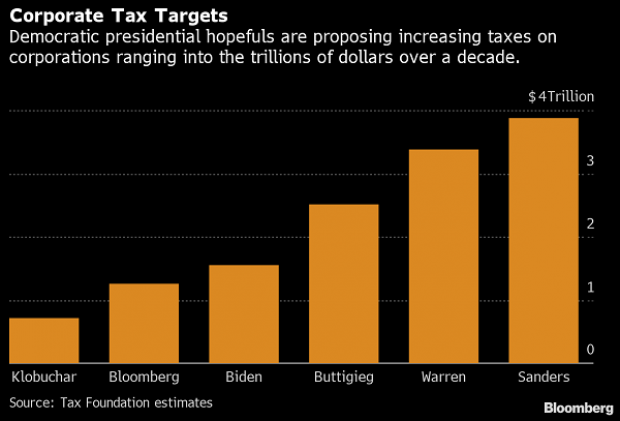
The leading candidates for the Democratic presidential nomination have all proposed increasing taxes on corporations, including raising income tax rates to levels ranging from 25% to 35%, up from the current 21% imposed by the Republican tax cuts in 2017. With Bernie Sanders leading the way at $3.9 trillion, here’s how much revenue the higher proposed corporate taxes, along with additional proposed surtaxes and reduced tax breaks, would generate over a decade, according to calculations by the right-leaning Tax Foundation, highlighted Wednesday by Bloomberg News.
Chart of the Day: Discretionary Spending Droops
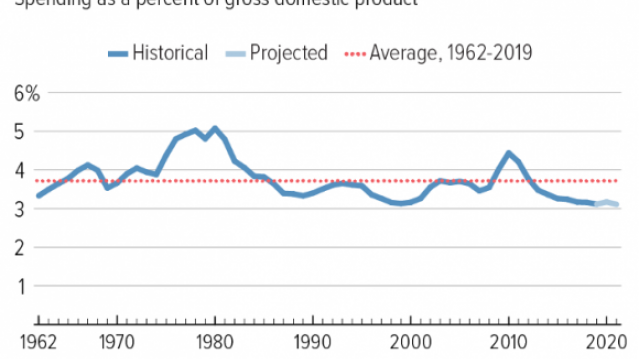
The federal government’s total non-defense discretionary spending – which covers everything from education and national parks to veterans’ medical care and low-income housing assistance – equals 3.2% of GDP in 2020, near historic lows going back to 1962, according to an analysis this week from the Center on Budget and Policy Priorities.
Chart of the Week: Trump Adds $4.7 Trillion in Debt
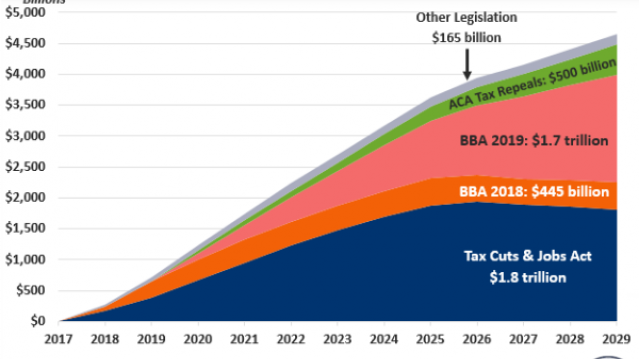
The Committee for a Responsible Federal Budget estimated this week that President Trump has now signed legislation that will add a total of $4.7 trillion to the national debt between 2017 and 2029. Tax cuts and spending increases account for similar portions of the projected increase, though if the individual tax cuts in the 2017 Republican overhaul are extended beyond their current expiration date at the end of 2025, they would add another $1 trillion in debt through 2029.
Chart of the Day: The Long Decline in Interest Rates

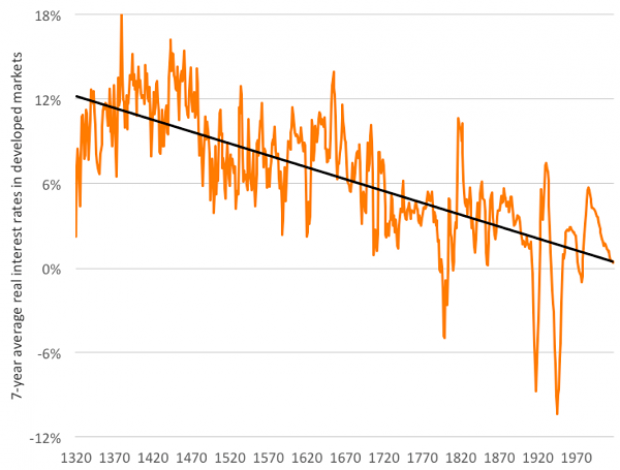
Are interest rates destined to move higher, increasing the cost of private and public debt? While many experts believe that higher rates are all but inevitable, historian Paul Schmelzing argues that today’s low-interest environment is consistent with a long-term trend stretching back 600 years.
The chart “shows a clear historical downtrend, with rates falling about 1% every 60 years to near zero today,” says Bloomberg’s Aaron Brown. “Rates do tend to revert to a mean, but that mean seems to be declining.”
Chart of the Day: Drug Price Plans Compared

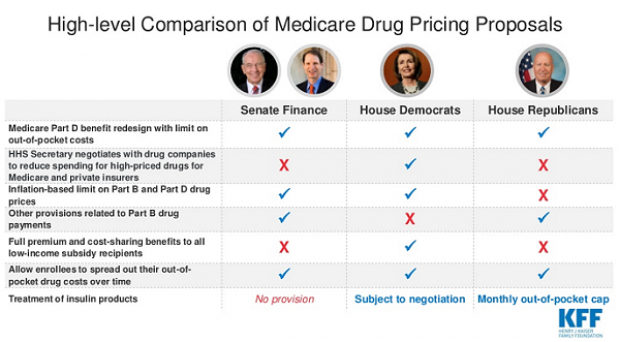
Lawmakers are considering three separate bills that are intended to reduce the cost of prescription drugs. Here’s an overview of the proposals, from a series of charts produced by the Kaiser Family Foundation this week. An interesting detail highlighted in another chart: 88% of voters – including 92% of Democrats and 85% of Republicans – want to give the government the power to negotiate prices with drug companies.

