Dow Sheds Nearly 600 Points, S&P 500 in Correction in a Wild Day on Wall Street
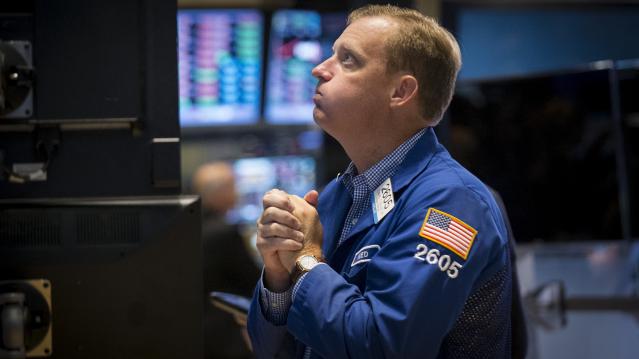
U.S. stocks plunged more than 3.5 percent on Monday, closing off session lows in high volume trade as fears of slowing growth in China pressured global markets.
S&P 500 ended nearly 80 points lower, off session lows of about 104 points lower but still in correction territory after the tech sector failed intraday attempts to post gains. Cumulative trade volume was 13.94 billion shares, the highest volume day since Aug. 10, 2011.
The major averages had a volatile day of trade, plunging sharply in the open and more than halving losses to trade less than 1 percent lower on the day, before closing down more than 3.5 percent.
"I think we probably rallied too fast. A lot of people that covered their shorts got their shorts covered," said Peter Coleman, head trader at Convergex. He noted the Dow was still trading several hundred points off session lows and that a close better than 500 points lower would be a good sign.
Related: The Stock Market's Fed Fever Is Only Going to Get Worse
"The market's going to be focused on China tonight to see if they come on tonight with something that would be considered a viable (way) to stimulate growth in that economy," said Quincy Krosby, market strategist at Prudential Financial.
The Dow Jones industrial average ended nearly 600 points lower after trading in wide range of between roughly 300 to 700 points lower in the minutes leading up to the close.
In the open, the index fell as much as 1,089 points, making Monday's move its biggest intraday swing in history. In midday trade, the index pared losses to trade about 110 points lower.
The blue-chip index posted its biggest 3-day point loss in history of 1,477.45 points.
During the first 90 minutes of trade, the index traveled more than 3,000 points in down and up moves.
"I'm hoping for some stability here but I think markets remain very, very vulnerable to bad news (out of) emerging markets," said Dan Veru, chief investment officer at Palisade Capital Management.
He attributed some of the sharp opening losses to exchange-traded funds. "It's so easy to move a bajillion dollars in a nanosecond."
Trading in stocks and exchange-traded funds was paused more than 1,200 times on Monday, Dow Jones said, citing exchanges. Such pauses total single digits on a normal day, the report said. An increase or decline of five percent or more triggers a five-minute pause in trading, Dow Jones said.
The major averages came sharply off lows in midday trade, with the Nasdaq off as low as less than half a percent after earlier falling 8.8 percent. Apple traded more than 1.5 percent lower after reversing losses to briefly jump more than 2 percent.
"There was sort of a lack of follow-through after the morning's crazy action in the overall market," said Robert Pavlik, chief market strategist at Boston Private Wealth. "The selling really dissipated once we got to around 10 o'clock."
He attributed some of the late morning gains to a short squeeze and bargain hunting.
Art Hogan, chief market strategist at Wunderlich Securities, noted that the sharp opening losses were due to great uncertainty among traders and the implementation of a rare market rule.
The New York Stock Exchange invoked Rule 48 for the Monday stock market open, Dow Jones reported.
The rule allows NYSE to open stocks without indications. "It was set up for situations like this," Hogan said. The rule was last used in the financial crisis.
Stock index futures for several major indices fell several percentage points before the open to hit limit down levels.
Circuit breakers for the S&P 500 will halt trade when the index decreases from its previous close by the following three levels: 7 percent, 13 percent, and 20 percent.
"Fear has taken over. The market topped out last week," said Adam Sarhan, CEO of Sarhan Capital. "We saw important technical levels break last week. Huge shift in investor psychology."
"The market is not falling on actual facets of a sub-prime situation. It's falling on fear of the unload of China. That's really behind this move," said Peter Cardillo, chief market economist at Rockwell Global Capital.
The CBOE Volatility Index (VIX), considered the best gauge of fear in the market, traded near 40. Earlier in the session the index leaped above 50 for the first time since February 2009.
"When the VIX is this high it means there's some panic out there," said Randy Frederick, managing director of trading and derivatives at Charles Schwab.
However, he said with stocks more than halving losses he "wouldn't be surprised if we closed positive." "If you could move it that far you could move it another 350 points" on the Dow," he said.
Overseas, European stocks plunged, with the STOXX Europe 600 down more than 5 percent, while the Shanghai Composite dropped 8.5 percent, its greatest one-day drop since 2007.
Treasury yields came off session lows, with the U.S. 10-year yield at 2.01 percent and the 2-year yield at 0.58 percent.
The U.S. dollar fell more than 1.5 percent against major world currencies, with the euro near $1.16 and the yen stronger at 119 yen versus the greenback.
A U.S. Treasury Department spokesperson said in a statement that "We do not comment on day-to-day market developments. As always, the Treasury Department is monitoring ongoing market developments and is in regular communication with its regulatory partners and market participants."
The Dow transports ended more than 3.5 percent lower to approach bear market territory.
About 10 stocks declined for every advancer on the New York Stock Exchange, with an exchange volume of 901 million and a composite volume of 4 billion as of 2:05 p.m.
Crude oil futures settled down $2.21, or 5.46 percent, at $38.24 a barrel, the lowest since February 2009. In intraday trade, crude oil futures for October delivery fell as much as $2.70 to $37.75 a barrel, a six-and-a-half-year low.
Gold futures settled down $6.10 at $1,153.60 an ounce.
This post originally appeared on CNBC. Read More at CNBC:
- Wharton's Siegel: We're going to test, possibly break this morning's lows
- Barclays: Fed unlikely to hike before March 2016
- One of Wall St's biggest bulls throws in the towel
Chart of the Day: Boosting Corporate Tax Revenues

The leading candidates for the Democratic presidential nomination have all proposed increasing taxes on corporations, including raising income tax rates to levels ranging from 25% to 35%, up from the current 21% imposed by the Republican tax cuts in 2017. With Bernie Sanders leading the way at $3.9 trillion, here’s how much revenue the higher proposed corporate taxes, along with additional proposed surtaxes and reduced tax breaks, would generate over a decade, according to calculations by the right-leaning Tax Foundation, highlighted Wednesday by Bloomberg News.

Chart of the Day: Discretionary Spending Droops

The federal government’s total non-defense discretionary spending – which covers everything from education and national parks to veterans’ medical care and low-income housing assistance – equals 3.2% of GDP in 2020, near historic lows going back to 1962, according to an analysis this week from the Center on Budget and Policy Priorities.
Chart of the Week: Trump Adds $4.7 Trillion in Debt

The Committee for a Responsible Federal Budget estimated this week that President Trump has now signed legislation that will add a total of $4.7 trillion to the national debt between 2017 and 2029. Tax cuts and spending increases account for similar portions of the projected increase, though if the individual tax cuts in the 2017 Republican overhaul are extended beyond their current expiration date at the end of 2025, they would add another $1 trillion in debt through 2029.
Chart of the Day: The Long Decline in Interest Rates

Are interest rates destined to move higher, increasing the cost of private and public debt? While many experts believe that higher rates are all but inevitable, historian Paul Schmelzing argues that today’s low-interest environment is consistent with a long-term trend stretching back 600 years.
The chart “shows a clear historical downtrend, with rates falling about 1% every 60 years to near zero today,” says Bloomberg’s Aaron Brown. “Rates do tend to revert to a mean, but that mean seems to be declining.”

Chart of the Day: Drug Price Plans Compared

Lawmakers are considering three separate bills that are intended to reduce the cost of prescription drugs. Here’s an overview of the proposals, from a series of charts produced by the Kaiser Family Foundation this week. An interesting detail highlighted in another chart: 88% of voters – including 92% of Democrats and 85% of Republicans – want to give the government the power to negotiate prices with drug companies.
