GOP Tax Cuts Getting Less Popular, Poll Finds
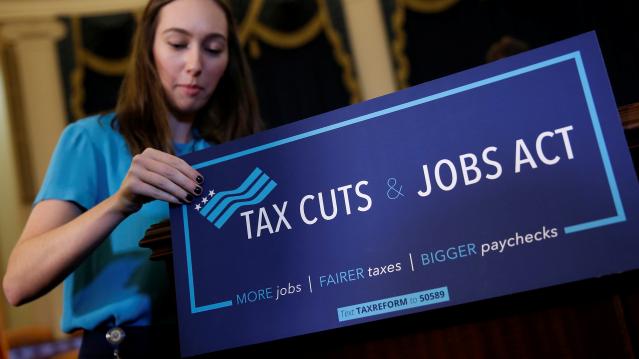
Friday marked the six-month anniversary of President Trump’s signing the Republican tax overhaul into law, and public opinion of the law is moving in the wrong direction for the GOP. A Monmouth University survey conducted earlier this month found that 34 percent of the public approves of the tax reform passed by Republicans late last year, while 41 percent disapprove. Approval has fallen by 6 points since late April and disapproval has slipped 3 points. The percentage of people who aren’t sure how they feel about the plan has risen from 16 percent in April to 24 percent this month.
Other findings from the poll of 806 U.S. adults:
- 19 percent approve of the job Congress is doing; 67 percent disapprove
- 40 percent say the country is heading in the right direction, up from 33 percent in April
- Democrats hold a 7-point edge in a generic House ballot
Chart of the Day: Boosting Corporate Tax Revenues

The leading candidates for the Democratic presidential nomination have all proposed increasing taxes on corporations, including raising income tax rates to levels ranging from 25% to 35%, up from the current 21% imposed by the Republican tax cuts in 2017. With Bernie Sanders leading the way at $3.9 trillion, here’s how much revenue the higher proposed corporate taxes, along with additional proposed surtaxes and reduced tax breaks, would generate over a decade, according to calculations by the right-leaning Tax Foundation, highlighted Wednesday by Bloomberg News.

Chart of the Day: Discretionary Spending Droops

The federal government’s total non-defense discretionary spending – which covers everything from education and national parks to veterans’ medical care and low-income housing assistance – equals 3.2% of GDP in 2020, near historic lows going back to 1962, according to an analysis this week from the Center on Budget and Policy Priorities.
Chart of the Week: Trump Adds $4.7 Trillion in Debt

The Committee for a Responsible Federal Budget estimated this week that President Trump has now signed legislation that will add a total of $4.7 trillion to the national debt between 2017 and 2029. Tax cuts and spending increases account for similar portions of the projected increase, though if the individual tax cuts in the 2017 Republican overhaul are extended beyond their current expiration date at the end of 2025, they would add another $1 trillion in debt through 2029.
Chart of the Day: The Long Decline in Interest Rates

Are interest rates destined to move higher, increasing the cost of private and public debt? While many experts believe that higher rates are all but inevitable, historian Paul Schmelzing argues that today’s low-interest environment is consistent with a long-term trend stretching back 600 years.
The chart “shows a clear historical downtrend, with rates falling about 1% every 60 years to near zero today,” says Bloomberg’s Aaron Brown. “Rates do tend to revert to a mean, but that mean seems to be declining.”

Chart of the Day: Drug Price Plans Compared

Lawmakers are considering three separate bills that are intended to reduce the cost of prescription drugs. Here’s an overview of the proposals, from a series of charts produced by the Kaiser Family Foundation this week. An interesting detail highlighted in another chart: 88% of voters – including 92% of Democrats and 85% of Republicans – want to give the government the power to negotiate prices with drug companies.
