The Covid-19 pandemic “dramatically disrupted” the usual flow of funds between the federal government and states, according to a new report from the Rockefeller Institute of Government, which details how the crisis shifted the normal balance of payments.
Among the findings:
All states received more from the federal government than they sent: “In more conventional years, states with a large number of high-income residents such as New York, California, New Jersey, and Illinois pay more in taxes than they receive in Federal spending making them net donor states,” Laura Schultz, the executive director of research at the Rockefeller Institute of Government and author of the report, writes.
In fiscal year 2020, though, there were no “donor states” as all states received more in federal spending than they sent to the U.S. government. That was a first since at least fiscal year 2015, when the Rockefeller Institute began tracking such data.
Federal pandemic spending also shifted the relative positions of states regarding federal payments, as populous states including California, Texas, Florida and New York received larger shares of federal aid. California, for example, rose from 47th in Rockefeller’s balance of payments rankings for fiscal year 2019 to first in 2020 while New York rose from 50th to fifth. Meanwhile, less populous states dropped in the rankings, with Alaska falling from 28 to 42 and South Dakota sliding from 34 to 47.
“The changes in the relative position of the states in this year’s balance of payments is likely to continue for the next few years,” the report says, adding that it is almost certain that there were no net donor states in fiscal year 2021 — though that will eventually revert to look more like it was pre-pandemic.
“It is likely that once the last of the COVID-19 funds are spent, we will return to the norms that are driven by demographic trends,” Schultz predicts. “The states with higher incomes, like New York, Massachusetts, Connecticut, New Jersey, and California, will regain their status as donor states to the Federal government.”
Per person federal spending skyrocketed: Federal spending jumped 47.3% in 2020, rising from $4.4 trillion in fiscal 2019 to $6.6 trillion. The federal government spent $8,801 more per person than it received in receipts, according to the Rockefeller report. “This represents a significant increase in the per capita balance of payments, which had grown from $1,304 in FFY 2015 to $2,394 in FFY 2019,” Schultz writes.
Largest states got the most business relief funds, but some smaller states got more per person: The four most populous states — California, Texas, Florida and New York — got $201 billion in forgivable Paycheck Protection Program loans and Economic Injury Disaster Loan Program grants, or 35.3% of the total spending in those programs. On a per capita basis, though, North Dakota topped the list, receiving $2,419 from business relief programs, or $717 more per person than the national average. Other states in the top 10 were Massachusetts, New York, Minnesota, New Jersey, South Dakota, Vermont, Connecticut, New Hampshire and Wyoming.
Emergency pandemic unemployment payments were very concentrated: The federal government spent $344.4 billion on a couple of emergency unemployment insurance programs that expanded usual benefits for workers who lost jobs. “The distribution of these unemployment funds was concentrated in a handful of states,” the report says, noting that the top five states collected nearly half of the unemployment funding. California received $68 billion, or about a fifth of the funds, while New York received $34.7 billion, or about 10%. Michigan got the most per capita, at $1,887, or more than seven times as much as the state with the least funding, South Dakota.
“The 10 states receiving the highest levels of per capita unemployment support included nine states ranking among the 10 with the highest levels of unemployment in 2020,” the report notes.
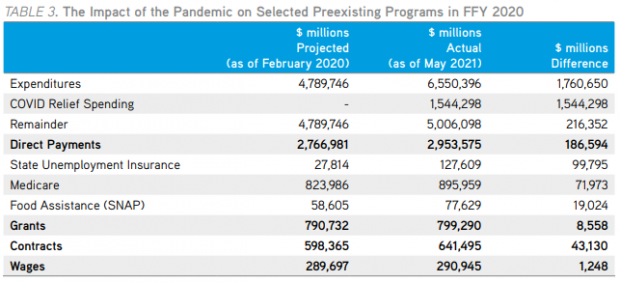
How safety net spending rose: Funding for programs including unemployment insurance, Medicare and food assistance all rose, as you’d expect. Federal spending on unemployment insurance, for example, topped projections made by the White House Office of Management and Budget in February 2020 by $100 billion. California ($19.1 billion), New York ($11.0 billion) and Texas ($7.7 billion) received the most in additional unemployment insurance. And the federal government spent $72 billion more on Medicare than originally projected.
Here’s a look at how some programs actual spending compared with projections made by the White House Office of Management and Budget in February 2020.