

|
With President Obama’s deficit-reduction plan now on the table, the political left, right and center are ready to rumble over how to assure long-term fiscal stability. The big questions are where to slash and by how much, but over the next year or two, the most important question for the economy might well be how quickly the cutting should begin. Households have become unusually dependent on the government for income support and removing that prop too fast could put the recovery at risk.
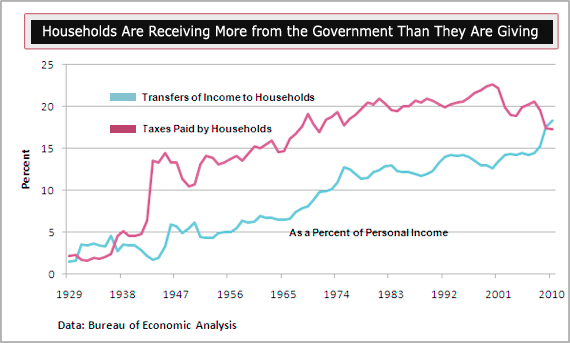
For the first time since the Great Depression, households are receiving more income from the government than they are paying the government in taxes. The combination of more cash from various programs, called transfer payments, and lower taxes has been a double-barreled boost to consumers’ buying power, while also blowing a hole in the deficit. The 1930s offer a cautionary tale: The only other time government income support exceeded taxes paid was from 1931 to 1936. That trend reversed in 1936, after a recovery was underway, and the economy fell back into a second leg of recession during 1937 and 1938.
As then, the pattern now reflects two factors: the severe depth of the 2007-09 recession and the massive fiscal policy response to it. The recession cut deeply into tax payments as more people lost their jobs, and it boosted payments for so-called automatic stabilizers, such as unemployment insurance, that ramp up payments as the economy turns down. Plus, policy actions, including the Recovery Act, boosted payments to households by expanding and extending jobless benefits and creating other income subsidies while extending the Bush-era tax cuts and adding new reductions in income and payroll taxes.
Government transfers of income to households started to overtake personal taxes at the start of 2008, and the gap has been widening. In February, households received more than $2.3 trillion in income support from unemployment benefits, Social Security, disability insurance, Medicare, Medicaid, veterans’ benefits, education assistance and other cash transfers of government funds to individuals. In the same month, households paid $2.2 trillion in income, payroll, and other taxes. The difference was about $150 billion, equivalent to more than 1 percentage point of overall personal income and about four times the amount Republicans and Democrats agreed to cut from government spending through Sept. 30.
Since the onset of the recession, government direct payments have increased by $579 billion, accounting for 79 percent of the growth in overall personal income. As job growth has picked up, that contribution has diminished, but during 2010, government cash still accounted for 28 percent of the increase in income. Not surprisingly, Social Security, including survivors’ and disability benefits, accounted for a significant portion of the increased payments and the amount paid out in unemployment benefits more than tripled over that period. At the same time, tax payments since the recession began have fallen by $312 billion, also providing a boost to consumers’ purchasing power.
Government Transfers of Income to Households | ||||||
2007 Q4 | 2010 Q4 | Change | ||||
Federal Social Benefits to Households | 1275.9 | 1742.1 | 466.2 | |||
Social Insurance Funds | 1071.8 | 1383.5 | 311.7 | |||
Social Security, Survivors, | 581.1 | 699.8 | 118.7 | |||
Medicare | 437.0 | 532.9 | 95.9 | |||
Unemployment | 35.1 | 129.0 | 93.9 | |||
Other Federal Social Insurance | 18.6 | 21.9 | 3.3 | |||
Veterans Benefits | 41.1 | 61.5 | 20.4 | |||
Supplemental Nutrition Assistance | 32.5 | 69.8 | 37.3 | |||
Earned Income Credit | 54.8 | 73.0 | 18.2 | |||
Supplemental Security Income | 37.9 | 45.3 | 7.4 | |||
Other Federal Benefits | 37.8 | 109.0 | 71.2 | |||
State & Local Benefits | 444.0 | 556.8 | 112.8 | |||
Medicaid & Other Medical Care | 344.9 | 442.1 | 97.2 | |||
Other State & Local Benefits | 99.0 | 114.7 | 15.7 | |||
Total Government Transfers to Households | 1719.9 | 2298.9 | 579.0 | |||
| Data: Bureau of Economic Analysis | ||||||
Typically, the gap between transfers and taxes runs the other way – and by a wide margin. “In normal times the household sector gives about 8 percentage points more of its income in taxes than it receives in direct transfers,” says J.P. Morgan economist Michael Feroli. The potential problem over the next few years is the enormous drag on household income as stimulus measures such as the payroll tax cut and extended unemployment benefits expire. Even if unemployment declines from its current level, the labor markets may not be strong enough to generate the wage and salary income needed to offset that drag.
Feroli says that if the net flow of taxes and transfers even partly returns to normal, the resulting drag on incomes would be significant. The size of the drag would be especially sensitive to how fast that flow is reversed. A shift all the way back to the average 8 percentage point difference between taxes and transfers would be equivalent to about $1.2 trillion in income. To put that in context, half that amount is equal to the total increase in personal income over the past year.
The Inflation Factor
Consumers needed support in the first quarter, as inflation from surging energy costs ate into the buying power of their incomes. Energy helped push the Consumer Price Index in March up 0.5 percent, with prices during the first quarter rising at a 6.1 percent annual rate, gobbling up most of last quarter’s increase in income. Even with a reduced tax burden of about $60 billion last quarter, mainly reflecting the 2 percent cut in payroll taxes, inflation-adjusted spending appears to have grown only half as fast as the fourth quarter’s 4 percent pace. A tepid rise in March retail sales implies little momentum heading into the second quarter.
An increasing number of economists are downgrading their expectations for first quarter economic growth, to be reported on Apr. 28, and for the rest of the year. The drag from costlier energy is lasting longer than expected, and uncertainties over the impact of Japan’s struggles and the ongoing turmoil in the Middle East are weighing on growth. Obama’s recent deal with the GOP to cut nearly $40 billion from the federal budget for fiscal 2011 is equivalent to about 0.5 percentage points of GDP over the next six months, although the timing of those cuts is not yet set.
All this should be a yellow flag for the White House and Congress as they work toward reducing the deficit. Until the labor markets are strong enough to power consumer spending without the outsized income support from the government, withdrawing that support too quickly could put spending and the economy at risk to some unexpected shock.
Related Links:
House Passes Ryan’s Controversial Budget Plan (The Fiscal Times)
Welfare Nation: Government Handouts Make Up One Third of America’s Salaries and Wages (Daily Mail)
Deficit Debate May Keep Fed on Edge (CNN Money)


