The Shocking Secret About How Your Car Insurance Rate Gets Set

Most drivers probably know that if they get into an accident, their insurance rates are also likely to take a hit. But a new analysis by Consumer Reports finds that your car insurance premiums are increasingly based on factors such as your credit score that are unrelated to your driving record.
How well you drive may actually have little connection to how much you pay for insurance, the consumer group found.
In a two-year investigation, Consumer Reports analyzed more than 2 billion insurance price quotes obtained from more than 700 insurers across the country. It found that in many states a bad credit history will drive up your insurance premiums more than a drunk driving conviction.
“What we found is that behind the rate quotes is a pricing process that judges you less on driving habits and increasingly on socioeconomic factors,” the consumer organization reports. “These include your credit history, whether you use department-store or bank credit cards, and even your TV provider. Those measures are then used in confidential and often confounding scoring algorithms.”
Consumer Reports says it found that most car insurance companies use about 30 elements of the nearly 130 available in a credit report to construct their own secret score for policyholders, and that credit scores could have more of an impact on premiums than any other factor. Drivers with the best credit scores were charged up to $526 less than similar drivers with only “good” scores, depending on where they lived. Only three states — California, Hawaii and Massachusetts — prohibit insurers from factoring in credit scores when setting prices.
Drivers are legally required to carry car insurance, but the lack of pricing transparency makes it harder for them to make informed decisions about which policy to buy. “Because insurance companies are under no obligation to tell you what score they have cooked up for you, you have no idea whether you have a halo over your head or a bull’s-eye on your back for a price increase,” Consumer Reports says.
Industry advertising that promotes special discounts, such as for bundling home and car insurance, only muddles the purchasing process because those special deals don’t actually save people much money, Consumer Reports found.
The organization says it’s high time for truth in car insurance, and it’s asking consumers to sign a petition demanding that insurers -- and the state regulators who oversee them -- use price-setting practices that are tied to more meaningful factors, like driving records. It is also asking consumers to tweet the National Association of Insurance Commissioners, @NAIC_News, and tell them to “Price me by how I drive, not by who you think I am! #FixCarInsurance.”
For more information on state-by-state insurance premiums, or to sign the Consumer Reports petition, go to ConsumerReports.org/FixCarinsurance.
Top Reads From The Fiscal Times:
- Americans Are About to Get a Nice Fat Pay Raise
- How Millenials Could Damage the U.S. Economy
- The Pain the Job Numbers Don’t Show
Chart of the Day: Boosting Corporate Tax Revenues
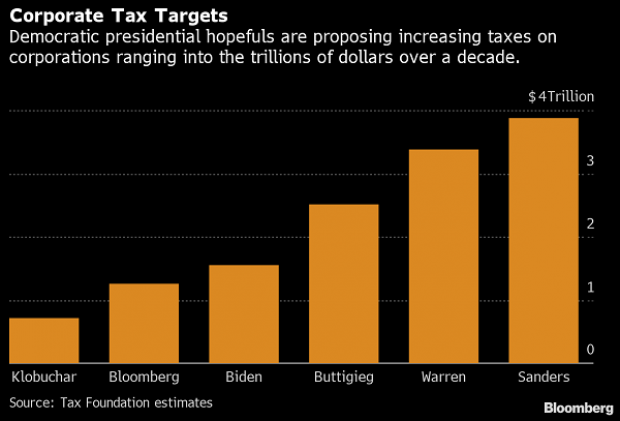
The leading candidates for the Democratic presidential nomination have all proposed increasing taxes on corporations, including raising income tax rates to levels ranging from 25% to 35%, up from the current 21% imposed by the Republican tax cuts in 2017. With Bernie Sanders leading the way at $3.9 trillion, here’s how much revenue the higher proposed corporate taxes, along with additional proposed surtaxes and reduced tax breaks, would generate over a decade, according to calculations by the right-leaning Tax Foundation, highlighted Wednesday by Bloomberg News.
Chart of the Day: Discretionary Spending Droops
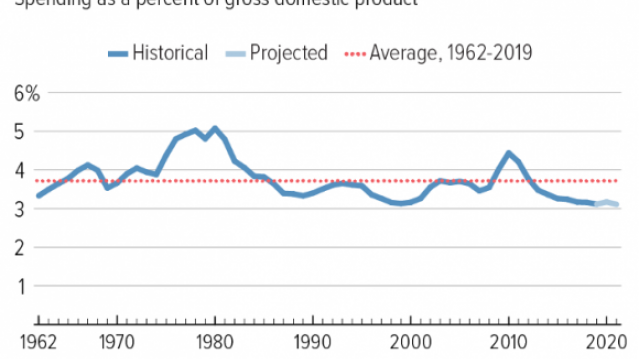
The federal government’s total non-defense discretionary spending – which covers everything from education and national parks to veterans’ medical care and low-income housing assistance – equals 3.2% of GDP in 2020, near historic lows going back to 1962, according to an analysis this week from the Center on Budget and Policy Priorities.
Chart of the Week: Trump Adds $4.7 Trillion in Debt
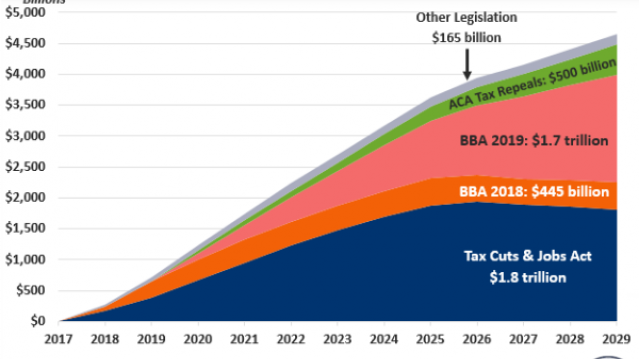
The Committee for a Responsible Federal Budget estimated this week that President Trump has now signed legislation that will add a total of $4.7 trillion to the national debt between 2017 and 2029. Tax cuts and spending increases account for similar portions of the projected increase, though if the individual tax cuts in the 2017 Republican overhaul are extended beyond their current expiration date at the end of 2025, they would add another $1 trillion in debt through 2029.
Chart of the Day: The Long Decline in Interest Rates

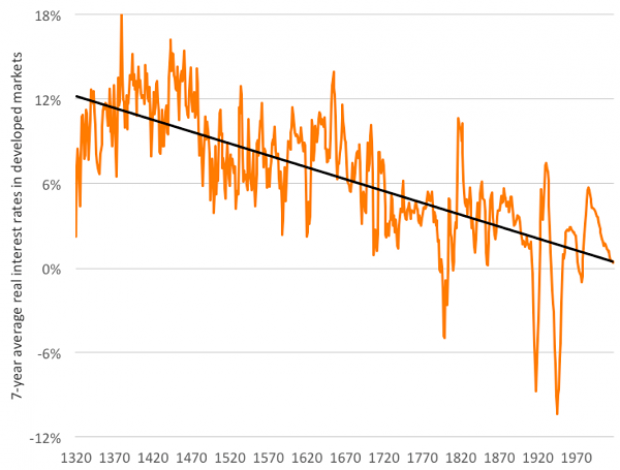
Are interest rates destined to move higher, increasing the cost of private and public debt? While many experts believe that higher rates are all but inevitable, historian Paul Schmelzing argues that today’s low-interest environment is consistent with a long-term trend stretching back 600 years.
The chart “shows a clear historical downtrend, with rates falling about 1% every 60 years to near zero today,” says Bloomberg’s Aaron Brown. “Rates do tend to revert to a mean, but that mean seems to be declining.”
Chart of the Day: Drug Price Plans Compared

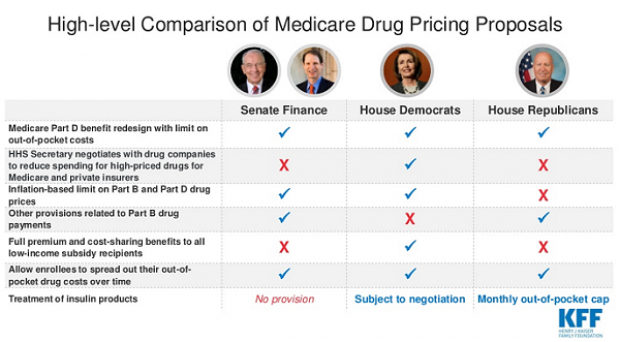
Lawmakers are considering three separate bills that are intended to reduce the cost of prescription drugs. Here’s an overview of the proposals, from a series of charts produced by the Kaiser Family Foundation this week. An interesting detail highlighted in another chart: 88% of voters – including 92% of Democrats and 85% of Republicans – want to give the government the power to negotiate prices with drug companies.

