Former CBO Chief: Congress Never Meant to Limit Obamacare Subsidies
A Supreme Court ruling expected this summer will determine whether the federal government can subsidize the insurance costs of individuals in states that did not establish their own health care exchanges under the Affordable Care Act.
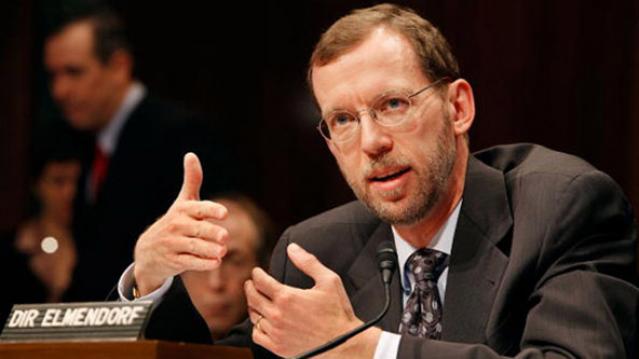
Douglas Elmendorf was the director of the Congressional Budget Office when Congress debated the bill, and on Tuesday he provided some ammunition to backers of the law who insist that that Congress did not intend to prevent payments of subsidies to consumers in states using the federal exchange.
Related: How Obamacare Could Be Squeezing Consumer Spending
In an interview with CNBC’s John Harwood at the Peter G. Peterson Foundation’s 2015 Fiscal Summit*, Elmendorf said that before the ACA passed, the CBO analyzed the bill for members of Congress, many of whom were powerfully opposed to it. At the time, he said, there was a common understanding on Capitol Hill that the subsidies would be available to states regardless of the status of their exchanges.
“That analysis was subject to a lot of very intense scrutiny and a lot of questions,” he said. “My colleagues and I can remember no occasion on which anybody asked why we were expecting subsidies to be paid in all states regardless of whether they established exchanges or not. And if people had not had this common understanding…then I’m sure we would have had a lot of questions about that.”
Pressed by Harwood, Elmendorf added, “My colleagues and I talked to a lot of people, with a lot of questions about nearly every aspect of the analysis that we did…and we could not remember anybody asking us any questions about what would happen in the federal exchange different from what would happen in the state exchanges.”
Even so, the language of the law states that the subsidies would apply to exchanges “established by the State” and the Supreme Court will decide how literally those words must be interpreted.
*Pete Peterson also funds The Fiscal Times.
Chart of the Day: Boosting Corporate Tax Revenues

The leading candidates for the Democratic presidential nomination have all proposed increasing taxes on corporations, including raising income tax rates to levels ranging from 25% to 35%, up from the current 21% imposed by the Republican tax cuts in 2017. With Bernie Sanders leading the way at $3.9 trillion, here’s how much revenue the higher proposed corporate taxes, along with additional proposed surtaxes and reduced tax breaks, would generate over a decade, according to calculations by the right-leaning Tax Foundation, highlighted Wednesday by Bloomberg News.

Chart of the Day: Discretionary Spending Droops

The federal government’s total non-defense discretionary spending – which covers everything from education and national parks to veterans’ medical care and low-income housing assistance – equals 3.2% of GDP in 2020, near historic lows going back to 1962, according to an analysis this week from the Center on Budget and Policy Priorities.
Chart of the Week: Trump Adds $4.7 Trillion in Debt

The Committee for a Responsible Federal Budget estimated this week that President Trump has now signed legislation that will add a total of $4.7 trillion to the national debt between 2017 and 2029. Tax cuts and spending increases account for similar portions of the projected increase, though if the individual tax cuts in the 2017 Republican overhaul are extended beyond their current expiration date at the end of 2025, they would add another $1 trillion in debt through 2029.
Chart of the Day: The Long Decline in Interest Rates

Are interest rates destined to move higher, increasing the cost of private and public debt? While many experts believe that higher rates are all but inevitable, historian Paul Schmelzing argues that today’s low-interest environment is consistent with a long-term trend stretching back 600 years.
The chart “shows a clear historical downtrend, with rates falling about 1% every 60 years to near zero today,” says Bloomberg’s Aaron Brown. “Rates do tend to revert to a mean, but that mean seems to be declining.”

Chart of the Day: Drug Price Plans Compared

Lawmakers are considering three separate bills that are intended to reduce the cost of prescription drugs. Here’s an overview of the proposals, from a series of charts produced by the Kaiser Family Foundation this week. An interesting detail highlighted in another chart: 88% of voters – including 92% of Democrats and 85% of Republicans – want to give the government the power to negotiate prices with drug companies.
