Millennials Like Saving Money, Want to Save More
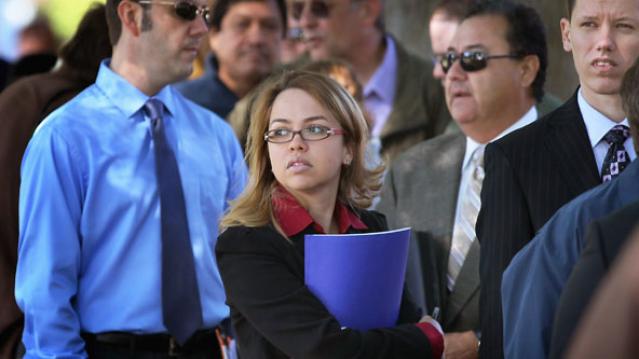
Millennials have impressive financial habits when compared to baby boomers, according to a new Retirement Saving & Spending Study by T. Rower Price. Millennials like to save, with many taking advantage of 401(k) plans while still paying down debt. On average, millennials are saving nearly as much for retirement -- 8 percent of their incomes -- as baby boomers, who are saving an average of 9 percent. And in the past 12 months, millennials are saving a higher percentage of their incomes than baby boomers when it comes to 401(k) contributions.
The research is based on online interviews with 1,505 millennials and 514 baby boomers with 401(k)s, and includes both workers and retirees.
Overall, millennials in the study report they are in surprisingly good financial shape. Eighty-eight percent say they are living within their means and 74 percent are more comfortable saving and investing extra money than spending it. However, many millennials are pessimistic about Social Security: Sixty percent expect Social Security to go bankrupt before they retire.
Here’s what else the survey reveals:
Millennials like to save, and they’d save more if they could.
Saving for retirement and paying down debt are equally important to millennials, who rank both goals as a top priority. For those who say they are not saving enough, 23 percent cited student loans as a major contributing factor.
Related Link: ‘Irresponsible’ Millennials Saving More Than Almost Every Other Group
Millennials like auto-enrollment plans.
Seventy-nine percent of the millennials who were auto-enrolled in 401(k) plans were satisfied with auto-enrollment. When it comes to 401(k) matches, 59 percent of millennials set their 401(k) contribution rate to take full advantage of their employers’ matches.
They’re open to advice and more likely to ask for help if they need it.
If faced with a sudden financial emergency, 55 percent of millennials said they’d seek the help of family and friends, compared to 24 percent of baby boomers. Millennials were also much more likely to admit they could benefit from help with spending and debt management.
They find it hard to save when they make less money.
Non-savers made less money and carried more student debt. The median personal income of non-savers was $28,000, compared to $57,000 for savers. Thirty-nine percent of the non-savers have trouble meeting their monthly expenses.
Men save more.
Millennial women are less likely to save in 401(k)s, even if they are eligible, and when they do, they save less than men. The average 401(k) balance for women participating in their 401(k) is $38,000, compared to an average 401(k) balance of $74,000 for men. Of those who are already participating in 401(k)s, only 41 percent of the savers are women.
Related link: Here Are 7 Ways People Screw Up Their 401(k)s


The 10 Worst States to Have a Baby

The birth rate in the U.S. is finally seeing an uptick after falling during the recession. Births tend to fall during hard economic times because having a baby and raising a child are expensive propositions.
Costs are not the same everywhere, though. Some states are better than others for family budgets, and health care quality varies widely from place to place.
A new report from WalletHub looks at the cost of delivering a baby in the 50 states and the District of Columbia, as well as overall health care quality and the general “baby-friendliness” of each state – a mix of variables including average birth weights, pollution levels and the availability of child care.
Mississippi ranks as the worst state to have a baby, despite having the lowest average infant-care costs in the nation. Unfortunately, the Magnolia State also has the highest rate of infant deaths and one of lowest numbers of pediatricians per capita.
Related: Which States Have the Most Unwanted Babies?
On the other end of the scale, Vermont ranks as the best state for having a baby. Vermont has both the highest number of pediatricians and the highest number of child centers per capita. But before packing your bags, it’s worth considering the frigid winters in the Green Mountain State and the amount of money you’ll need to spend on winter clothing and heat.
Here are the 10 worst and 10 best states for having a baby:
Top 10 Worst States to Have a Baby
1. Mississippi
- Budget Rank: 18
- Health Care Rank: 51
- Baby Friendly Environment Rank: 29
2. Pennsylvania
- Budget Rank: 37
- Health Care Rank: 36
- Baby Friendly Environment Rank: 51
3. West Virginia
- Budget Rank: 13
- Health Care Rank: 48
- Baby Friendly Environment Rank: 50
4. South Carolina
- Budget Rank: 22
- Health Care Rank: 43
- Baby Friendly Environment Rank: 49
5. Nevada
- Budget Rank: 39
- Health Care Rank: 35
- Baby Friendly Environment Rank: 46
6. New York
- Budget Rank: 46
- Health Care Rank: 12
- Baby Friendly Environment Rank: 47
7. Louisiana
- Budget Rank: 8
- Health Care Rank: 50
- Baby Friendly Environment Rank: 26
8. Georgia
- Budget Rank: 6
- Health Care Rank: 46
- Baby Friendly Environment Rank: 43
9. Alabama
- Budget Rank: 3
- Health Care Rank: 47
- Baby Friendly Environment Rank: 44
10. Arkansas
- Budget Rank: 12
- Health Care Rank: 49
- Baby Friendly Environment Rank: 37
Top 10 Best States to Have a Baby
1. Vermont
- Budget Ranks: 17
- Health Care Rank: 1
- Baby Friendly Environment Rank: 5
2. North Dakota
- Budget Rank: 10
- Health Care Rank: 14
- Baby Friendly Environment Rank: 10
3. Oregon
- Budget Rank: 38
- Health Care Rank: 2
- Baby Friendly Environment Rank: 14
4. Hawaii
- Budget Rank: 31
- Health Care Rank: 25
- Baby Friendly Environment Rank: 1
5. Minnesota
- Budget Rank: 32
- Health Care Rank: 5
- Baby Friendly Environment Rank: 12
6. Kentucky
- Budget Rank: 1
- Health Care Rank: 33
- Baby Friendly Environment Rank: 20
7. Maine
- Budget Rank: 25
- Health Care Rank: 10
- Baby Friendly Environment Rank: 15
8. Wyoming
- Budget Rank: 22
- Health Care Rank: 17
- Baby Friendly Environment Rank: 7
9. Iowa
- Budget Rank: 14
- Health Care Rank: 25
- Baby Friendly Environment Rank: 9
10. Alaska
- Budget Rank: 50
- Health Care Rank: 6
- Baby Friendly Environment Rank: 2
Top Reads From The Fiscal Times
- The 10 Worst States for Property Taxes
- Americans Are About to Get a Nice Fat Pay Raise
- You’re Richer Than You Think. Really.
Worried About a Recession? Here’s When the Next Slump Will Hit

The next recession may be coming sooner than you think.
Eleven of the 31 economists recently surveyed by Bloomberg believed the American recession would hit in 2018, and all but two of them expected the recession to begin within the next five years.
If the recession begins in 2018, the expansion would have lasted nine years, making it the second-longest period of growth in U.S. history after the decade-long expansion that ended when the tech bubble burst in 2001. This average postwar expansion averages about five years.
The recent turmoil in the stock market and the slowdown in China has more investors and analysts using the “R-word,” but the economists surveyed by Bloomberg think we have a bit of time. They pegged the chance of recession over the next 12 months to just 10 percent.
Related: Stocks Are Sending a Recession Warning
While economists talk about the next official recession, many average Americans feel like they’re still climbing out of the last one. In a data brief released last week, the National Employment Law Project found that wages have declined since 2009 for most U.S. workers, when factoring in cost of living increases.
A full jobs recovery is at least two years away, according to an analysis by economist Elise Gould with the Economic Policy Institute. “Wage growth needs to be stronger—and consistently strong for a solid spell—before we can call this a healthy economy,” she wrote in a recent blog post.
Top Reads from The Fiscal Times:
- This CEO Makes 1,951 Times More Than Most of His Workers
- Seven Reasons Why the Fed Won’t Hike Interest Rates
- $42 Million for 54 Recruits: U.S. Program to Train Syrian Rebels Is a Disaster