Get Ready for Your 'Daily Glitch'—The NYSE, WSJ and United Were Just the Beginning

“Glitch” is clearly the word of the moment, after a series of pesky little technical problems forced United Airlines to ground flights, halted New York Stock Exchange trading and took down The Wall Street Journal website homepage all on the same day. If that wasn’t enough technical trouble, Seattle’s 911 system went down briefly. And a couple of NASA spacecraft also suffered “glitches” in recent days.
We deal routinely with glitches these days — a Wi-Fi connection goes down, an app freezes, a plug-in (usually Shockwave) stops responding, an email doesn’t load properly — which may help explain why, aside from lots of grumbling from delayed airline passengers, the reaction to Wednesday’s glitches was rather muted. The NYSE problems were reportedly caused by a “configuration issue” after a software update and United blamed its problem on “degraded network connectivity.” We see those issues every day, just not on as large a scale.
But that’s the problem.
At the risk of sounding like a high school term paper, let us note that the Merriam-Webster definition of glitch is “an unexpected and usually minor problem; especially: a minor problem with a machine or device (such as a computer).” The full definition describes it as a minor problem that causes a temporary setback.
Sure, Wednesday’s setbacks were all temporary. The Wall Street Journal site came back up quickly. Seattle’s 911 service was restored. Action on the NYSE itself was stopped for nearly four hours, but even then traders were still able to buy and sell NYSE-listed stocks on other exchanges. United grounded about 3,500 flights, which meant some people missed a wedding or a crucial business meeting. That will take time to sort out, but it will get sorted out.
In aggregate, though, the problems add up — and the word “glitch” only minimizes what can be much bigger, more serious issues..
Stock exchanges have suffered from a series of stoppage-causing glitches in recent years, pointing to the value of having trading spread across numerous exchanges. United’s tech breakdown “marked the latest in a series of airline delays and cancellations in the last few years that experts blame on massive, interconnected computer systems that lack sufficient staff and financial backing,” the Los Angeles Times reports. Just ask any of the roughly 400,000 United passengers whose travel plans were messed up if this was a little glitch. Or maybe check with the engineers who had to troubleshoot and rebuild the HealthCare.gov site after its glitch-laden launch.
It may be some relief that these latest outages weren’t the result of external attacks, but as sociologist Zeynep Tufecki, an assistant professor at the School of Information at the University of North Carolina, writes at The Message, “The big problem we face isn’t coordinated cyber-terrorism, it’s that software sucks. Software sucks for many reasons, all of which go deep, are entangled, and expensive to fix.”
These foul-ups are now mundane, and to some extent they may be inevitable as we rely more and more on complicated computer systems in every aspect of our lives. That’s the real issue, and it’s a lot bigger than a glitch.
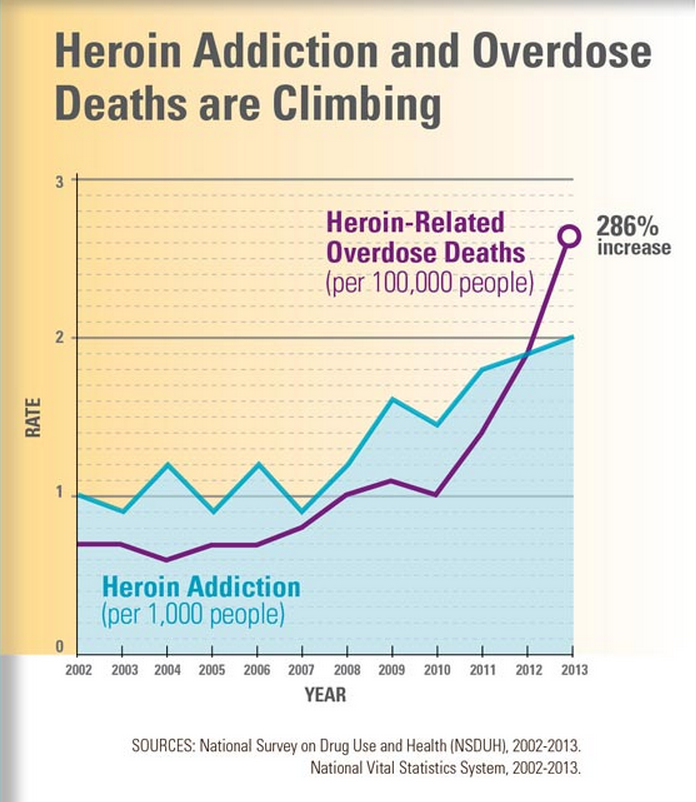
The Rapidly Rising Death Toll of the Heroin Epidemic
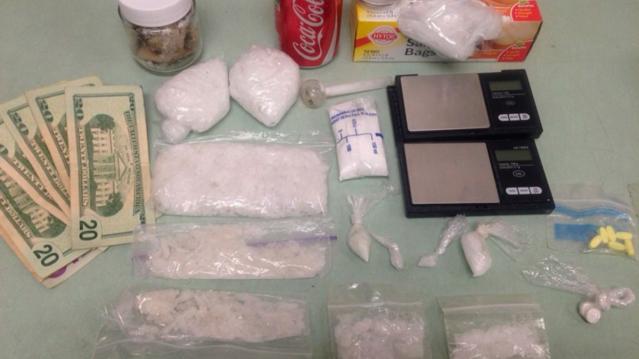
The death toll from the heroin epidemic has been climbing dramatically in recent years — and the annual rate of overdose deaths nearly doubled between 2011 and 2013, according to a new CDC study.
From 2002 through 2013, heroin use in the United States rose by 63 percent, and the rate of abuse or dependence climbed a staggering 90 percent. Deaths from heroin-related overdoses nearly quadrupled, with more than 8,200 people dying in 2013 alone.
The CDC report says that heroin use has increased across most demographic groups — men and women, most age groups, and across all income levels. Rates of heroin use are still highest among men, those ages 18 to 25, people with income less than $20,000 a year, people in urban areas, and those who do not have health insurance or are on Medicaid. But other groups are turning to the drug, too. “Some of the greatest increases occurred in demographic groups with historically low rates of heroin use: women, the privately insured and people with higher incomes,” the CDC says.
The heroin trend isn’t happening in isolation, the CDC study says. Almost all heroin users — 96 percent — also took at least one other drug, and 61 percent used at least three other drugs. Abuse or dependence on opioid painkillers is the strongest risk-factor for heroin use or addiction, the report says, with cocaine addiction also high on the list. People who are addicted to prescription opioid painkillers are 40 times more likely to use or be addicted to heroin, and 45 percent of people who used heroin were also addicted to painkillers.
Another key reason is that heroin is becoming cheaper and more widely available. According to the DEA, the increase in heroin seizures in the U.S. from 2010 and 2014 rose 81 percent, from 2,763 kilograms to 5,014 kilograms. More and more law enforcement agencies are identifying heroin as their primary drug threat, but the CDC report suggests that health care workers focus on reducing the abuse of painkillers by improving prescribing practices.
The study also recommends that states increase access to “medication-assisted treatment” programs that use methadone, buprenorphine and naltrexone along with behavioral counseling. And it says the rapid rise in heroin-related deaths highlights an “urgent need” to broaden access to naloxone, a drug that can reverse the effects of heroin and opioid overdose.
Here’s Why Economists Are Worried About A New Housing Bubble

After posting their 39th consecutive month of year-over-year price gains, home prices in 33 states and the District of Columbia are at or within 10 percent of record highs, according to a report issued today by CoreLogic.
Home prices increased 6.3 percent year-over-year in May, and 1.7 percent month-over-month. Relatively low mortgage rates have helped fuel the price gains. In cities like San Francisco, where there is limited supply and high demand, prices are growing at a double-digit clip.
Prices are so high in certain areas that some economists are starting to worry about localized bubbles. The number of homes on the market is increasing slightly. Total housing inventory at the end of may reached 2.29 million houses, 1.8 percent more than this time last year, according to the National Association of Realtors. That’s a 5.1-month supply, giving sellers a slight edge in today’s market. (A six-month supply is considered a healthy market.)
Related: Get ready for Another Real Estate Bubble
South Carolina saw the biggest price gains, with homes showing annual appreciation of 10.3 percent. Other states showing big gains were Colorado (9.8 percent) and Washington (8.8 percent), CoreLogic reports.
High prices have also spurred builders to start constructing new single-family homes, sales of which increased 23 percent year-over-year in May.
While most states have seen price gains, five states (Massachusetts, Connecticut, Maryland, Mississippi, and Louisiana) saw local home prices fall in May.
CoreLogic economists expect prices to increase 5.1 percent year-over-year in June and 0.8 percent month to month.
Looking for Likes? When to Post on Facebook for Maximum Attention

Trying to decide when to post photo updates to your “Summer 2015” album so the maximum number of people click through, comment on, and like your filtered selfies? Look no further. A new study conducted by the social media analytics firm Klout can tell you the best time and day of the week to post on Facebook and Twitter, depending where you are in the world.
The study found that posting in the late morning and early afternoons on Tuesdays and Wednesdays tends to generate the most engagement. Thursdays tend to be quiet, Fridays are quieter still, and the weekends are the quietest. On Mondays, the activity level begins to ramp up again as the work week begins and bored office workers take social media breaks.
Optimal times also depend on location. Tokyo peaks at the earliest time among cities studied, between 7 a.m. and 9 a.m. Paris has a high level of engagement once in the morning and once in the afternoon. In San Francisco, between 9 a.m. and 10 a.m. is ideal for posting. The most favorable time in New York is just before noon. London peaks the latest, with users becoming fully engaged on Twitter and Facebook only in the early afternoon.
Thinking about posting a picture of your cute new nephew at night? Don’t even bother if you want maximum engagement from your followers and friends. While one explanation is that fewer people are online at night, another is that most likes, shares, and comments occur within a short window of time after someone posts something. Researchers of the study found the majority of reactions were within the first two hours of posting time.
Using a sample set of half a million active users and more than 25 million messages over 56 days, the report boasts a reaction gain of up to 4 percent on Twitter and 17 percent on Facebook when the recommended posting times are used.
Why We All Buy Tide: The 10 Biggest Advertisers in the U.S.
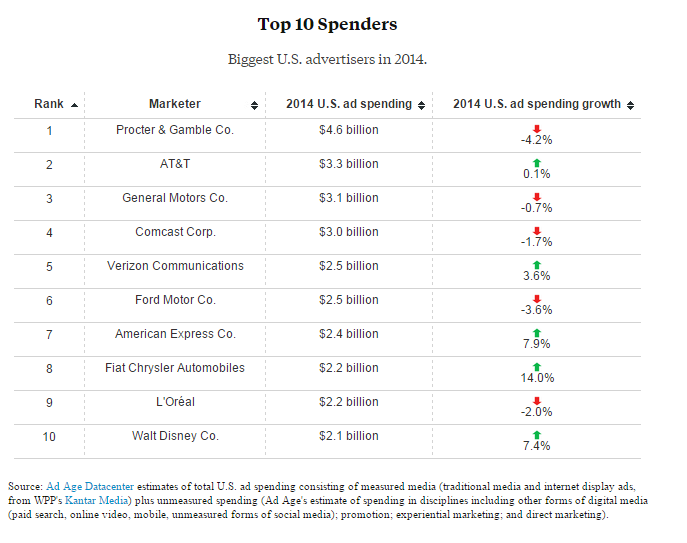
The 200 top national advertisers spent a record $137.8 billion last year trying to get you to buy more of their goods and services, an increase of 2 percent over 2013, according to Ad Age’s latest annual spending review.
That total was slightly more than the GDP of Hungary last year, but the growth rate was the lowest since 2009, as advertisers looked to get the most for their money. Internet display advertising among those 200 marketing Goliaths dropped by 13.3 percent.
Overall, 38 marketers spent more than $1 billion on advertising last year. Procter & Gamble remains the country’s (and the world’s) largest advertiser. It shelled out $4.6 billion in the U.S. alone to promote brands such as Crest, Duracell, Pampers and Tide — or well over $1 billion more than the next biggest spender. P&G’s CFO recently revealed plans to cut ad spending by as much as $500 million, though.
Here’s Ad Age’s list of the 10 biggest advertisers in the U.S. last year:
Why More Workers Are Saying ‘No Thanks’ to a Full-Time Job

After years of keeping a conservative head count, companies have finally started to hire workers again. But they may find that many workers aren’t interested in becoming full-time employees anymore.
Related: 6 Secrets of Successful Freelancers
The number of independent workers increased by 12 percent in the past five years, and nearly 80 percent of those who work for themselves plan on remaining independent, according to a new report by MBO Partners. One in seven non-independent workers is considering going freelance.
Nearly 80 percent of freelance workers say that they’re happier working for themselves, thanks to the flexibility of being their own boss. Plus, they’re earning decent money.
More than a quarter of independent workers earn more than $75,000 per year, and the number making more than $100,000 per year has surged by 45 percent to almost 3 million.
The majority of today’s freelancers have actively chosen to go independent. Technology has made the shift easier, and Obamacare has made it possible for independent workers to secure health benefits for themselves and their families. However, they may be slacking when it comes to retirement planning. Seven in 10 self-employer people don’t save for retirement regularly, according to a separate report from TD Ameritrade.
Related: The 10 Best Cities for Summer Travelers
The number of full-time, independent workers now totals nearly 18 million Americans, with another 12.5 million who doing contract work part-time. Independent workers say they feel more secure working freelance, thanks to an average of four or more revenue streams, according to the MBO Partners report.