The Kids Aren’t Alright: More Millennials Are Living with Their Parents

Pity the millennial, poster child of the Great Recession. A popular meme portrays the typical millennial as a basement-dwelling economic loser, forever condemned to live in the nether regions of his parent’s house. Unfortunately, that meme is not without basis. The recession seem to have hit millennials particularly hard, making it even more difficult for young people to find good jobs and to establish their own households.
In some respects, things are looking up for millennials. The U.S. job market is strengthening, making it easier to find work, and wages are starting to creep higher. The unemployment rate for young adults (ages 18 to 34, excluding full-time college students) has been heading lower since peaking near 12 percent in 2010; the latest unemployment reading for millennials is 7.7 percent.
However, there is one notable sticking point, and it echoes that basement-dwelling meme. Even though household formation rates have rebounded overall, millennials are still not moving out and establishing their own households like they used to. In fact, more millennials are living with parents or relatives than before the recession, according to new research from Pew.
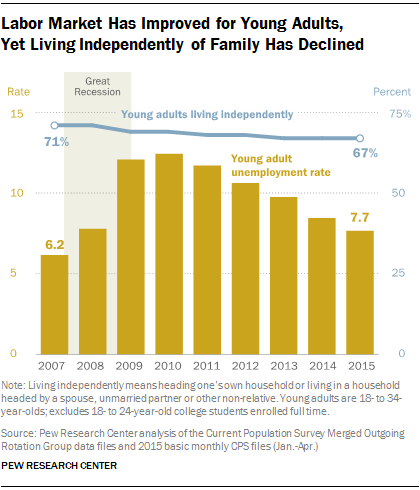
In 2007, before the recession hit, 71 percent of millennials were living independently. In 2015, that number has fallen to 67 percent, with no sign of bottoming.
On the flip side, 22 percent of young adults were living in their parents’ homes in 2007. That number has risen to 26 percent this year.
The Pew report doesn’t look at why millennials are sticking so close to home. However, it does suggest that the relatively simple economic argument about the lack of good jobs no longer tells the whole story. Since the economy is recovering, however unevenly, there are likely other factors in play. One could be cultural: More young people simply enjoy living at home and are in no hurry to move out. Perhaps the U.S. is becoming more like Italy, where adult children often live at home until they marry.
That’s not to say that money plays no role in the trend, though. One big economic factor not addressed in the Pew report is pretty basic: rising rents. This graphic from Zillow makes it clear that rents have been soaring all over the country. More than $3,000 for a one bedroom in San Francisco? With those kind of numbers, living at home makes all the sense in the world.
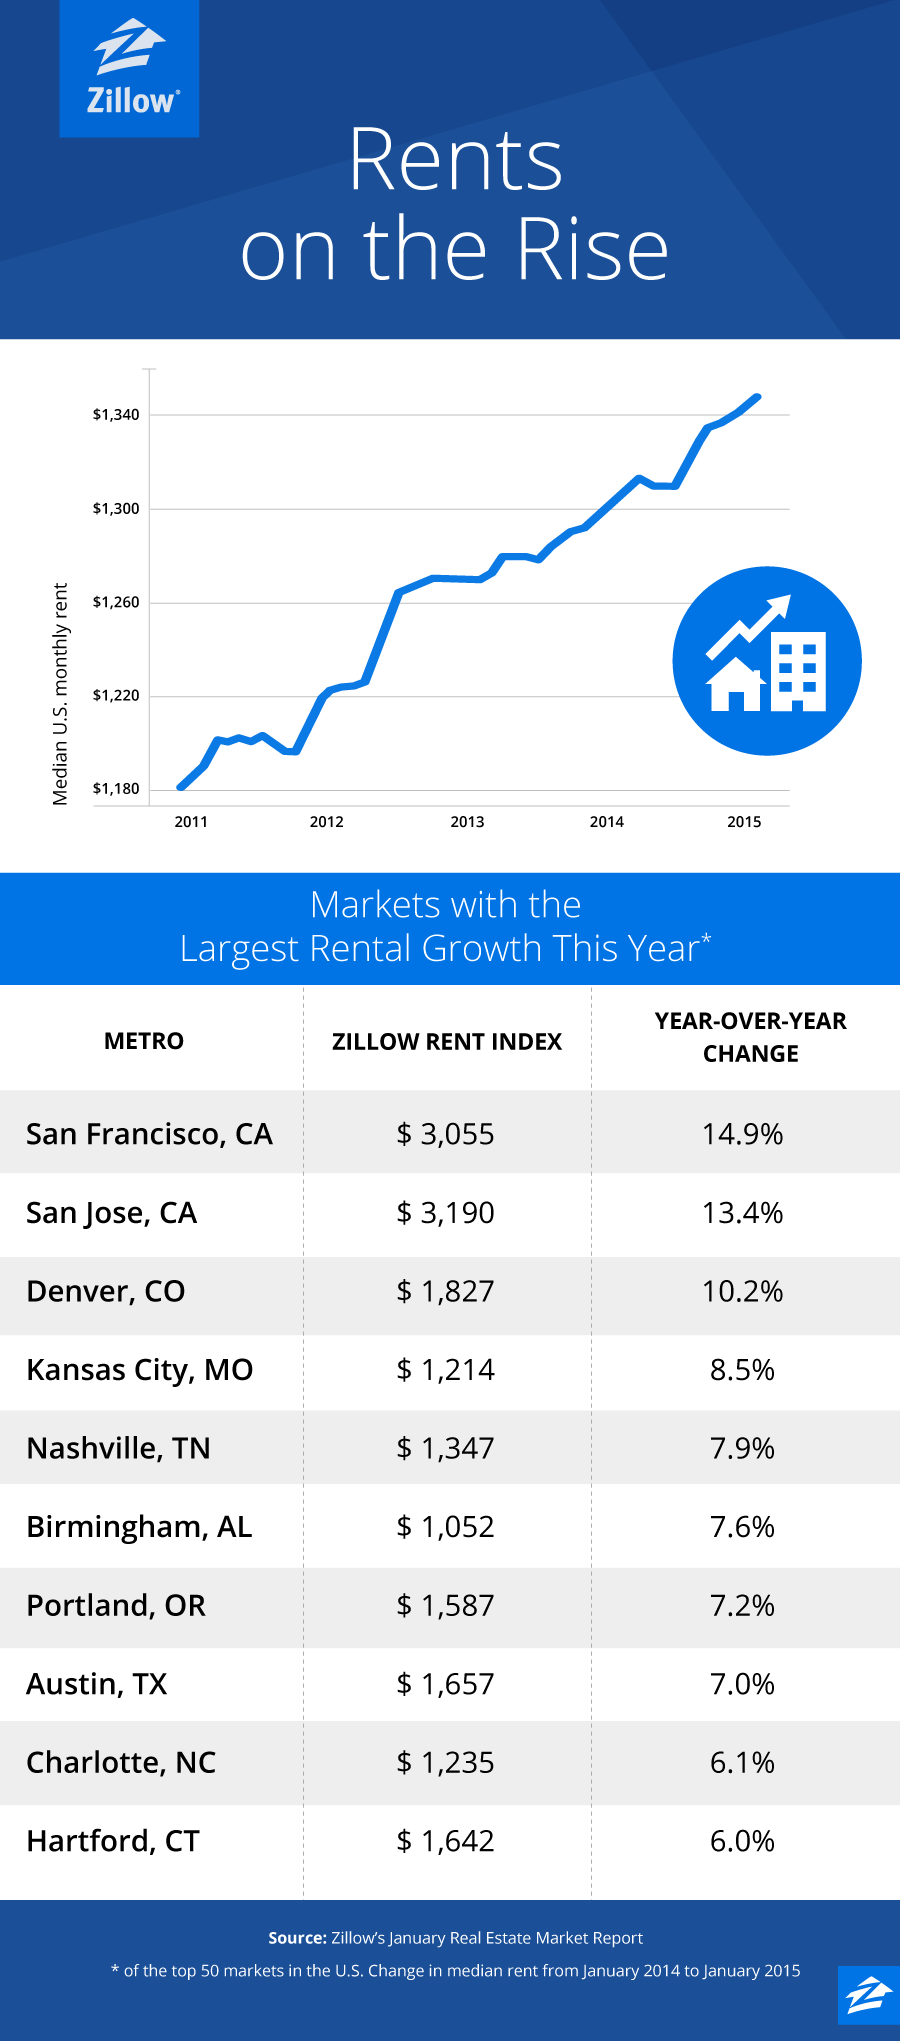
Chart of the Day: Boosting Corporate Tax Revenues

The leading candidates for the Democratic presidential nomination have all proposed increasing taxes on corporations, including raising income tax rates to levels ranging from 25% to 35%, up from the current 21% imposed by the Republican tax cuts in 2017. With Bernie Sanders leading the way at $3.9 trillion, here’s how much revenue the higher proposed corporate taxes, along with additional proposed surtaxes and reduced tax breaks, would generate over a decade, according to calculations by the right-leaning Tax Foundation, highlighted Wednesday by Bloomberg News.

Chart of the Day: Discretionary Spending Droops

The federal government’s total non-defense discretionary spending – which covers everything from education and national parks to veterans’ medical care and low-income housing assistance – equals 3.2% of GDP in 2020, near historic lows going back to 1962, according to an analysis this week from the Center on Budget and Policy Priorities.
Chart of the Week: Trump Adds $4.7 Trillion in Debt

The Committee for a Responsible Federal Budget estimated this week that President Trump has now signed legislation that will add a total of $4.7 trillion to the national debt between 2017 and 2029. Tax cuts and spending increases account for similar portions of the projected increase, though if the individual tax cuts in the 2017 Republican overhaul are extended beyond their current expiration date at the end of 2025, they would add another $1 trillion in debt through 2029.
Chart of the Day: The Long Decline in Interest Rates

Are interest rates destined to move higher, increasing the cost of private and public debt? While many experts believe that higher rates are all but inevitable, historian Paul Schmelzing argues that today’s low-interest environment is consistent with a long-term trend stretching back 600 years.
The chart “shows a clear historical downtrend, with rates falling about 1% every 60 years to near zero today,” says Bloomberg’s Aaron Brown. “Rates do tend to revert to a mean, but that mean seems to be declining.”

Chart of the Day: Drug Price Plans Compared

Lawmakers are considering three separate bills that are intended to reduce the cost of prescription drugs. Here’s an overview of the proposals, from a series of charts produced by the Kaiser Family Foundation this week. An interesting detail highlighted in another chart: 88% of voters – including 92% of Democrats and 85% of Republicans – want to give the government the power to negotiate prices with drug companies.
