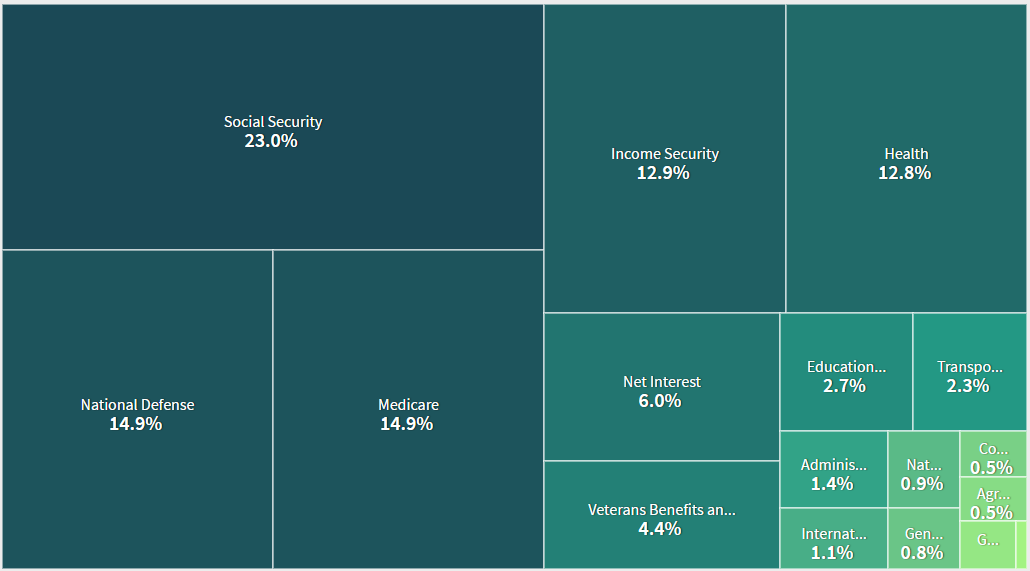
The federal government spent $3.85 trillion last year. Where did that money go? The Treasury Department today launched a new website that it says will help taxpayers find out.
The new site, created under the Digital Accountability and Transparency Act signed into law by President Obama in 2014 and in development for a couple of years, is still in beta, and the Treasury says it plans on adding more data and tools over time based on user feedback. In the meantime, the site’s search is still quite limited, less than intuitive and not fully functional. But even the site’s most basic elements provide enough fodder to suck you down a budget rabbit hole.
Before you go there, here are some answers to just where the 2016 spending went:
More than 30 percent of that nearly $4 trillion was on direct payments to individuals — think Social Security ($916.1 billion) and other benefits programs — while another 18.7 percent went to 326,000 for-profit contractors and commercial businesses. Nearly 30 percent (about $1.1 trillion) went to pay for running the federal government and “direct services” for the public. Another 17.4 percent was doled out in grants to state and local governments, and 5 percent went to 36,000 educational institutions and non-profits.
Here’s another way of slicing the spending: Of the roughly $2.75 trillion that went to individuals, private contractors, state and local governments and non-profits, almost $290 billion, or 9.7 percent, was spent in California, the most of any state. Sparsely populated Wyoming saw less of that money than any other state, $4.1 billion. A state-by-state breakdown of the $2.75 trillion is below.
| 2016 Federal Spending Awarded to Individuals, Private Contractors, Non-Profits and State/Local Governments, by State |
| State | Amount ($ Billions) | % of Total |
|---|---|---|
| Alabama | $66.91 | 2.20% |
| Alaska | $7.99 | 0.30% |
| Arizona | $71.56 | 2.40% |
| Arkansas | $22.93 | 0.80% |
| California | $289.68 | 9.70% |
| Colorado | $39.48 | 1.30% |
| Connecticut | $74.61 | 2.50% |
| Delaware | $6.63 | 0.20% |
| Florida | $171.05 | 5.70% |
| Georgia | $65.18 | 2.20% |
| Hawaii | $11.12 | 0.40% |
| Idaho | $12.34 | 0.40% |
| Illinois | $80.56 | 2.70% |
| Indiana | $128.42 | 4.30% |
| Iowa | $23.22 | 0.80% |
| Kansas | $16.23 | 0.50% |
| Kentucky | $89.30 | 3.00% |
| Louisiana | $35.42 | 1.20% |
| Maine | $11.66 | 0.40% |
| Maryland | $66.35 | 2.20% |
| Massachusetts | $62.37 | 2.10% |
| Michigan | $77.40 | 2.60% |
| Minnesota | $81.54 | 2.70% |
| Mississippi | $24.48 | 0.80% |
| Missouri | $52.97 | 1.80% |
| Montana | $8.22 | 0.30% |
| Nebraska | $12.31 | 0.40% |
| Nevada | $17.70 | 0.60% |
| New Hampshire | $9.71 | 0.30% |
| New Jersey | $60.81 | 2.00% |
| New Mexico | $22.83 | 0.80% |
| New York | $158.62 | 5.30% |
| North Carolina | $63.97 | 2.10% |
| North Dakota | $62.60 | 2.10% |
| Ohio | $76.12 | 2.60% |
| Oklahoma | $28.22 | 0.90% |
| Oregon | $32.04 | 1.10% |
| Pennsylvania | $193.60 | 6.50% |
| Rhode Island | $8.97 | 0.30% |
| South Carolina | $77.70 | 2.60% |
| South Dakota | $6.76 | 0.20% |
| Tennessee | $73.84 | 2.50% |
| Texas | $169.42 | 5.70% |
| Utah | $14.54 | 0.50% |
| Vermont | $5.49 | 0.20% |
| Virginia | $94.67 | 3.20% |
| Washington | $58.15 | 2.00% |
| West Virginia | $15.27 | 0.50% |
| Wisconsin | $84.18 | 2.80% |
| Wyoming | $4.15 | 0.10% |


