After ending last week in the red, the Dow Jones Industrial Average this week regained the 17,000 level and the S&P 500 is once again flirting with the 2,000 mark. The Russell 2000 small-cap index, though, has fallen into negative territory for the year-to-date.
Where we go from here depends largely on the same catalyst that drove the recent bout of weakness not only in stocks but in bonds, too: Apprehension over the Federal Reserve's first interest rate hike. The QE3 bond purchase program that began in 2012 is set to end next month. Wall Street analysts have been bringing forward their estimate of when the first interest rate hike will happen, with more and more expecting it to come in the middle of 2015 rather than later in the year.
Related: The Interest Rate Guessing Game Is Back in Style
Traditionally, the start of a Fed rate hike campaign would only prove to be a temporary hurdle for stocks since the need for higher rates reflected underlying strength in the real economy.
This is no normal business cycle, though. The Fed cut rates much deeper than usual. It has held rates low — historically low — for far longer than usual. And then it coupled those historically low rates with multiple programs of bond buying that have swelled the monetary base from $800 billion before the recession to more than $4 trillion now.
As a result, the financial system has been doped up on cheap money in a way that it never has before. No one knows what will happen when the monetary morphine is pulled away, but additional volatility is likely. We also have the upcoming Alibaba IPO, which is red hot and could suck some of the buying power away from other members in the tech sector.
Internally, the market is warning of trouble. My preferred measure is the percentage of S&P 500 stocks in uptrends overlaid with a parabolic stop-and-reverse indicator. While not perfect, it gives a nice indication of the waves of buying and selling, on an intermediate-term basis, that's driving the market.
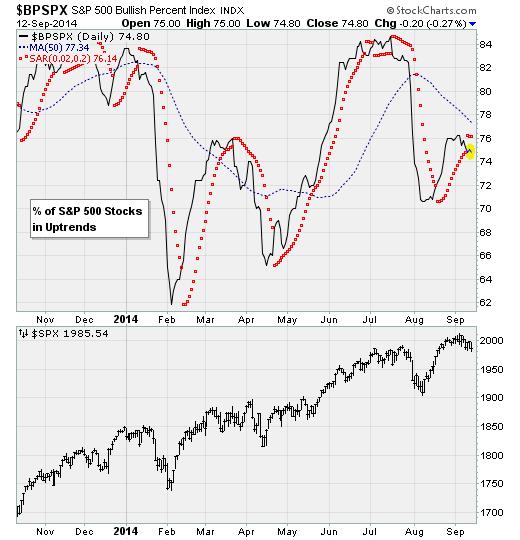
As of Friday, the measure indicated the start of a downtrend cycle for the first time since July. It could prove to be a head fake of the type we saw in late June. Yet it could also be the start of a more significant decline.
Related: What Happens When the Fed Stops Propping Up Stocks?
There were other problems heading into this week that led me to believe that the late August/early September market really wasn't as strong as it looked. Mainly, it's because those gains were powered by a relatively narrow subset of the market. You can see this in the way the percentage of NYSE stocks above their 50-day moving average peaked at just 65 percent recently, well off of the high of nearly 85 percent set back in July, when the Dow Jones Industrial Average was last at these levels.
Add it all up and there is plenty of evidence that justifies investors adopting a more defensive portfolio positioning.
Disclosure: I’ve recommended that my subscribers, admittedly a more active and aggressive group of traders, add leveraged, short positions in energy and Treasury ETFs.
Top Reads from The Fiscal Times:
- Six Years After Lehman’s Bankruptcy, Wall Street Is as Reckless as Ever
- Steve Forbes’s Golden Plan to Save the Economy
- The Threat That Could Scar the Economy for Decades