Automakers Are Having a Record Year, but Here’s a Trend that Should Worry Them

U.S. auto sales closed out the summer on a positive note, topping estimates and casting some rosy light on the health of the American consumer. Recording its best August since 2003, the auto industry is on pace to sell 17.8 vehicles in 2015, well ahead of expectations of 17.3 million. If the numbers hold up, 2015 will be the best year ever for U.S. auto sales, beating the 17.4 million mark set in 2000.
The general consensus is that auto industry is in pretty good shape these days. Gas prices and interest rates are low, boosting the market for cars and light trucks. More than 2 million jobs were added to the U.S. economy in the past year, and more jobs is usually good news for auto sales. The unemployment rate has been trending lower for five years, sitting at a relatively healthy 5.3 percent in July.
Related: What's Next for Oil Prices? Look Out Below!
As with any statistic, though, there’s more than one way to look at the situation. Sure, auto sales are climbing as the economy gets stronger and more Americans hit their local car dealers’ lots. At least to some degree, though, higher auto sales should be expected just as a result of U.S. population growth. And those rising monthly sales figures are masking a continuing trend that is more worrisome for the auto industry: per capita auto sales are still in a long-term decline, even including the solid growth the industry has seen since the end of the recession. Doug Short at Advisor Perspectives did the math and made a graph:

According to Short’s analysis, the peak year for per capita auto sales in the U.S. was 1978. As the red line in the graph shows, the trend is negative since then.
In the graph, per capita auto sales in January, 1976, were defined as 100; the readings in the index since then are relative to that 1976 sales level. As you can see, the index moves higher until August of 1978, when per capita auto sales were up nearly 20 percent over 1976. Since then, per capita auto sales have fallen, reaching a low in 2009 that was nearly 50 percent lower than 1976. Since 2009, per capita auto sales have risen nicely, but are still more than 15 percent below peak.
What could explain the negative trend? Two factors come to mind. First, demographics. It has been widely reported that the millennial generation is less interested in owning cars for a variety of reasons, ranging from a weak economy to a cultural shift away from suburban life. However, the data on millennial car purchases is ambiguous; recently, millennials have started buying cars in volumes that look a lot like their elders. And even if millennials are less interested in buying cars, their preferences can’t explain a shift that began in the 1970s, before they were born.
Related: U.S. Companies Are Dying Faster Than Ever
The other factor that may explain the trend is income inequality. A study of car ownership by the Carnegie Foundation found that countries with higher income inequality have fewer cars per capita. The logic is simple: As more income is claimed by the wealthy, there’s less to go around for everyone else. And that means there’s less money for middle and lower income groups to buy and maintain automobiles, among other things.
Here’s a chart of the Gini index for the U.S. since 1947. (The Gini Index is a widely-used measure of income inequality. A higher Gini number means higher inequality.) Note that the Gini reading started climbing in the late ‘70s – the same time when per capita car ownership in the U.S. began to fall.
This chart tells us, not for the first time, that the U.S. has experienced more income inequality since the 1970s. Combined with the per capita auto sales data above, it suggests that as the rich have gotten richer and everyone else has struggled to keep up, car ownership has suffered. Although this is by no means proof of the relationship between income inequality and per capita car ownership over the last 40 years, it hints at an interesting theory – and suggests that the auto industry has good reason to be concerned about growing inequality in the U.S.

Top Reads From The Fiscal Times:
- 6 Reasons Gas Prices Could Fall Below $2 a Gallon
- Hoping for a Raise? Here’s How Much Most People Are Getting
- What the U.S. Must Do to Avoid Another Financial Crisis
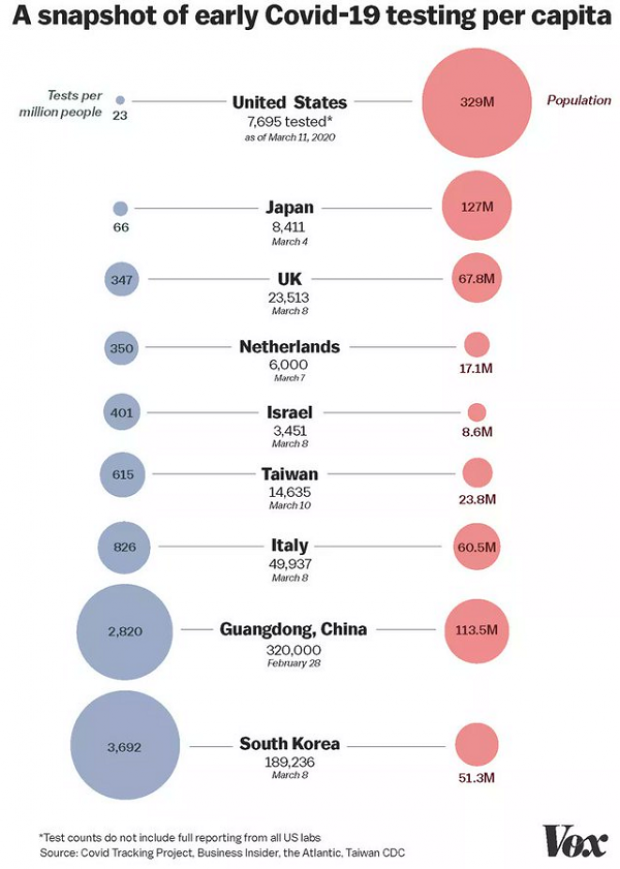
Chart of the Day: Long Way to Go on Coronavirus Testing

The White House on Friday unveiled plans for a new effort to ramp up testing for Covid-19, which experts say is an essential part of limiting the spread of the virus. This chart from Vox gives a sense of just how far the U.S. has to go to catch up to other countries that are dealing with the pandemic, including South Korea, the leading virus screener with 3,692 tests per million people. The U.S., by comparison, has done about 23 tests per million people as of March 12.
After Spending $2 Billion, Air Force Bails Out on Planned Upgrades of B-2 Bombers
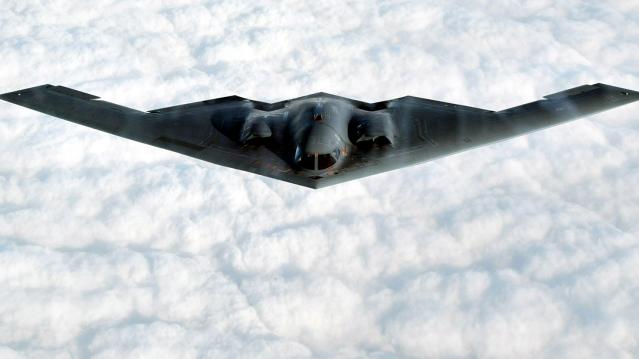
The Air Force has scrapped a planned upgrade of its B-2 stealth bomber fleet — even after spending $2 billion on the effort — because defense contractor Northrup Grumman didn’t have the necessary software expertise to complete the project on time and on budget, Bloomberg’s Anthony Capaccio reports, citing the Pentagon’s chief weapons buyer.
Ellen Lord, the undersecretary of defense for acquisition and sustainment, told reporters that the nearly $2 billion that had already been spent on the program wasn’t wasted because “we are still going to get upgraded electronic displays.”
Big Hurdle for Sanders’ Plan to Cancel Student Debt
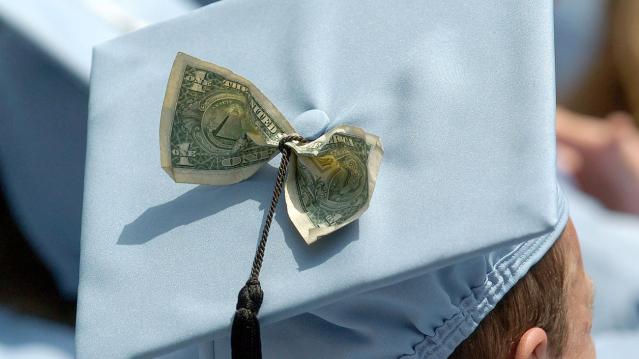
Bernie Sanders wants to eliminate $1.6 trillion in student debt, to be paid for by a tax on financial transactions, but doing so won’t be easy, says Josh Mitchell of The Wall Street Journal.
The main problem for Sanders is that most Americans don’t support the plan, with 57% of respondents in a poll last fall saying they oppose the idea of canceling all student debt. And the politics are particularly thorny for Sanders as he prepares for a likely general election run, Mitchell says: “Among the strongest opponents are groups Democrats hope to peel away from President Trump: Rust Belt voters, independents, whites, men and voters in rural areas.”
Number of the Day: $7 Million

That’s how much Michael Bloomberg is spending per day in his pursuit of the Democratic presidential nomination, according to new monthly filings with the Federal Election Commission. “In January alone, Bloomberg dropped more than $220 million on his free-spending presidential campaign,” The Hill says. “That breaks down to about $7.1 million a day, $300,000 an hour or $5,000 per minute.”