
I'm just going to say it: The stock market is downright boring right now.
The Dow Jones Industrial Average has again fallen below 18,000, a level it first tested in December. That's six months of no progress.
I can't say I'm surprised, after I warned investors in a column on Christmas Eve that the bulls had overdone it. The other big dynamic at the time was the end of the Federal Reserve's bond-buying stimulus. The end of prior iterations in 2010 and 2011 were followed by sharp market selloffs, as shown in the first chart below.
Related: Boomers, It's Time to Cash Out of This Bubble
This time, stocks have simply stayed in stasis: The S&P 500 hasn't suffered a correction of 10 percent or more since early 2012. But that looks set to end very soon.

On the surface, the market seems to be waiting for a resolution on two big unknowns. The first is the fate of Greek bailout negotiations, as Athens is potentially set to default on a batch of debt repayments to the International Monetary Fund totaling $1.8 billion if no deal is done before the end of the month. Stocks posted their best one-day gain in a month on Wednesday on reports Germany would be open to a piecemeal compromise deal. Stocks then trimmed gains on Thursday on reports the IMF had pulled its negotiating team due to a lack of progress. A deal remains a long way off.
The other big dynamic is the timing and pace of possible short-term interest rate hikes from the Federal Reserve this year, which would be the first policy tightening since 2006. We'll know more when the Fed concludes its next two-day policy meeting on June 17, but with job growth steady, inflation still low but stabilizing and retail sales rebounding, a September or even a July rate hike is coming into focus.
A negative outcome on one or both of these dynamics would likely shock stocks out of their three-year-long tranquility. My guess is that with Fed policymakers already more hawkish than the market in their interest rate hike expectations, based on their "dot plot" projections, it will be a Fed hike that rattles sentiment.
Related: Four Reasons Oil Could Fall to $40 a Barrel
Whatever the trigger, market insiders are already feeling nervous; reflecting fragility below the surface that the Dow's steadfast adherence to the 18,000 level belies.

A technical analysis pattern called a Hindenburg Omen was triggered Thursday thanks to divergences between price, new highs, new lows and advancing and declining measures of market internals. Just look at the way the percentage of NYSE stocks above their 50-day moving average has been rolling over since late May, as shown in the chart above.
While not a perfect signal (admittedly, there is no such thing in technical analysis) Hindenburg Omens have in the past been somewhat reliable warnings of approaching market weakness since they reflect a withdrawal of broad buying interest. (Admittedly, they have appeared numerous times in recent years without being followed by massive selloffs.)
Another way to think of this is that as breadth weakens, the market is relying on fewer and fewer stocks to stay aloft. One such stock is Apple (AAPL), to which the overall market is currently tracking to a historic degree (a concept known as statistical correlation). In layman's terms: This is like a magician's trick, distracting you with one hand — Apple — while preparing a surprise with the other (the rollover of a growing percentage of less closely followed stocks).
Also, while everyone is focused on headlines out of Greece or on every economic data point for its impact on Fed policy, the fundamental justification for Dow 18,000 continues to deteriorate.
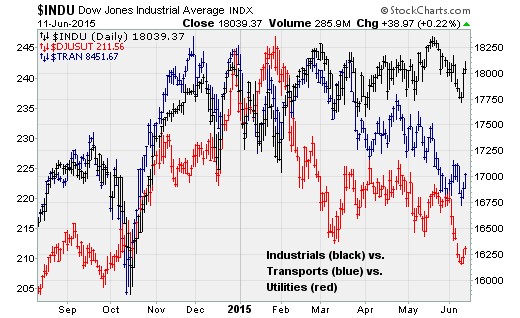
So-called Dow Theory is flashing a big fat warning signal, as the Dow Jones Industrial Average stands near record highs while transportation and utility stocks have slumped. All three peaked in unison at the end of 2014 but have been diverging since. Transports are down 9.1 percent from their high. Utilities are down more than 14 percent.
Finally, a combination of still-low energy prices, a tightening job market, rising labor costs and tepid GDP growth continues to weigh on corporate revenue growth. Given the surge of corporate borrowing and the additional leverage on balance sheets (funding debt-fueled share buybacks and dividends), this is a problem since companies have increased their "gearing" or how sensitive net earnings are to changes in revenue growth.

The chart above shows how business sales are falling at a 2.3 percent annual rate, suggesting downside ahead for S&P 500 revenues. This pace of decline has been associated with the start of the last two recessions. Not even the 1998 mid-cycle slowdown featured a pullback of this magnitude. The drags from both lower energy prices (as I explained in a recent column) and from a tighter job market are set to continue.
Over the next four weeks, we're going to get resolutions on Greece, clarity on the Fed’s rate hike timing, and begin the second-quarter earnings-reporting season. Based on market breadth and Dow Theory, stocks should move lower in response.
Top Reads from The Fiscal Times: