The Most Expensive Cities for Singles -- and the Cheapest

Looking for love in all the pricey places? Check out these lists of the most and least expensive cities for singles before you go on that next date or plan your next move. Looking good doesn’t come cheap, and the price of a decent wardrobe and a gym membership add ups before you even step out the door.
To determine which cities were the least and most affordable for singles, GoBankingRates examined 89 cities and rated them according to four expense categories -- clothing, dates, gym memberships and rent -- using data from Numbeo.com. “Singles are more likely to exercise, and to have a gym membership,” says Elyssa Kirkham, a finance writer for GoBankingRates. “They’re more likely to rent than own a home, and spend more money on dates and clothing.”
Related: Hot New Dating Criteria: What’s Your Credit Score?
San Francisco is the most expensive city for singles, especially when it comes to rent. Rent is 30 percent more expensive in San Francisco than it is in Honolulu. The cost of a date here is $147, compared with the median cost of $109. California just might be the most expensive state to date in, claiming seven of the top 15 spots: San Francisco, Fremont, Glendale, Irvine, Los Angeles, San Diego and Oakland.
The second most expensive city? New York City, which boasts the most expensive gym membership at $90 per month. Clothing costs here are the second-highest in the nation -- bad news for all the Carrie Bradshaws out there. And date night will set you back $145.
The most expensive date night in the country is in Washington, D.C., which came in third overall. Date night in our nation’s capital costs $166 for dinner, a bottle of wine, two movie tickets and a 10-mile taxi ride. Compare that to Chattanooga, Tennessee, which had the cheapest date night at $78.
Looking for more bang for your buck? Move to Reno, Nevada. Rent here is just 86 cents per square foot, and a night out averages $97.30. Keep in mind, though, that “the Biggest Little City in the World” was once known as the divorce capital of the world, so dating there may offer less promise than other locales.
Related: The Bad News About All the Singles in America
Most Expensive Cities for Singles
- San Francisco
- New York
- Washington, D.C.
- Honolulu
- Boston
- Fremont, California
- Glendale, California
- Anchorage, Alaska
- Miami
- Seattle
- Irvine, California
- Los Angeles
- San Diego
- Oakland, California
- Madison, Wisconsin
Related: Marriage?? Young Americans Aren’t Even Shacking Up
15 Cheapest Cities for Singles
- Reno, Nevada
- Tucson, Arizona
- Grand Rapids, Michigan
- Tacoma, Washington
- Indianapolis
- Mesa, Arizona
- Little Rock, Arkansas
- Albuquerque, New Mexico
- Huntsville, Alabama
- Memphis, Tennessee
- St. Louis, Missouri
- Jackson, Mississippi
- Stockton, California
- Omaha, Nebraska
- Chattanooga, Tennessee
4 Ways to Fix Social Security

Social Security celebrates its 80th birthday today, and the popular program that provides paychecks for 44 million elderly Americans is in need of a safety net of its own.
As the amount claimed by recipients continues to outpace the amount of money contributed by workers, the system will need to dip into its reserves to keep up with its obligations by 2020. Within 15 years after that (if nothing changes), those reserves will be gone and the system will only be able to pay 77 cents on every dollar owed, an amount that will continue to decrease with time.
The problem is even more acute given that future retirees won’t have the same access to pensions that many current retirees use to fund their retirement, and younger workers haven’t saved nearly enough to cover the costs they’ll face when they stop working.
To close the projected gap, the country needs to raise revenue, reduce benefits or some combination of the two. Here are four of the most commonly proposed solutions:
1. Raise the retirement age. For most Americans, the full retirement age (at which you can get full benefits) ranges from 65 through 67. Advocates of this solution would reduce the amount the government pays in Social Security by gradually pushing back the age at which you’re eligible for full benefits.
The drawback: Many Americans are already forced into retirement before they reach age 65. If they claim early and receive reduced benefits they may not have enough money to meet their basic needs. Also, workers in physically demanding jobs many not be able to work those extra years.
2. Raise the payroll cap. Social Security is funded via payroll taxes, which currently are only levied on the first $118,500 of income. That means that high earners effectively pay a much lower rate toward Social Security than others. Hiking or eliminating that cap, advocates say, would create a fairer system and increase revenue.
The drawback: Critics of this solution claim that increasing taxes on middle- and upper-income earners would reduce their income and stifle the country’s economic growth.
Related: 6 Popular Social Security Myths Busted
3. Institute a means test. While the vast majority of recipients (80 percent, per AARP) rely on Social Security as an integral part of funding their retirement, extremely high net worth individuals don’t need the additional income. This solution would create a net worth or retirement income threshold over which eligibility for social security phases out.
The drawbacks: It could be politically difficult to settle on a threshold, which might vary depending on the geography of a recipient. Plus, this would require people to pay into a system from which they get no benefits.
4. Freeze the cost of living adjustment. Social Security payments have historically been adjusted based on inflation as measured by the Consumer Price Index. This has been minimal in recent years, but the long-term, compounding effect of inflation makes this provision incredibly expensive.The drawbacks: For many people, Social Security is the only inflation-linked retirement income stream that they have. Limiting it could push some retirees over the financial edge as prices rise.
The Surprising Reason for the Boom in Snack Sales

Americans are increasingly dining alone, and they’re opting for snacks rather than full meals, according to a new report from NPD group.
A key driver of the trend is the growing number of single-person households, since solo eaters are more likely to opt for snack foods for dinner. Nearly a quarter of all snack foods consumed last year were consumed at mealtime.
“Smaller household sizes and eating alone are among the growing factors with snacking,” NPD food and beverage industry analyst Darren Seifer said in a statement. “Food manufacturers should think about the unique needs of the solo consumer when developing products and packaging, and marketing messages should be crafted to be relevant to them and their snacking behaviors.”
Related: The 12 Hottest Food Trends for 2015
A separate report released by Nielsen last year found that more than half of global diners had selected snacks in the past 30 days to replace a lunch, 48 percent had snacked for breakfast and 41 percent had snacked for dinner.
When making their selection, single diners prefer single-serve packages and are increasingly turning to “better-for-you” snacks, like fresh fruit, breakfast bars, and yogurt, NPD found.
Food manufacturers are starting to adapt to the demand for healthier options. In June, General Mills said it would stop using artificial colors and flavors by 2016, and Kellogg Co. has vowed to do so by 2018.
Even as demand grows for healthier snacks, the most popular snacks in North Americans might make a nutritionist cringe. Nielsen found that the most popular snacks were chips, followed by chocolate and cheese.
Top Reads from the Fiscal Times:
- The $1 Trillion Question for the F-35: Is the U.S. Buying an Inferior Plane?
- Hillary’s College Plan—Debt Free College Now, Tax Them When They Make Money
- You Won’t Believe What Some Job Seekers Are Putting on Their Resumes
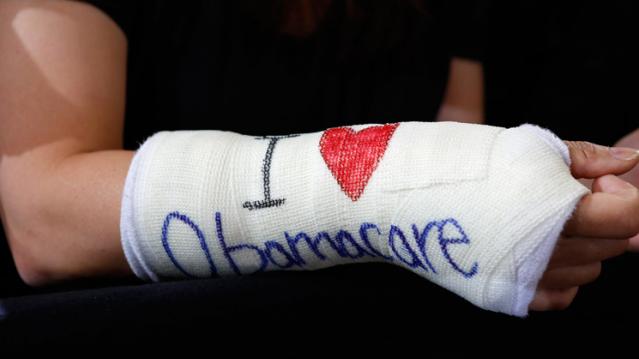
Obamacare Drives Uninsured Rate to Record Low
With the number of Americans lacking health insurance in decline, the rate of uninsured Americans has hit a record low, reaching levels not seen since the National Center for Disease Statistics began keeping records in 1972.
In the first quarter of 2015, 9.2 percent of all Americans were uninsured, according to new data from the Center for Disease Control and Prevention, down from 11.5 percent in 2014. The total number of uninsured Americans fell by 7 million over the past year, from 36 million in 2014 to 29 million in the first three months of 2015.
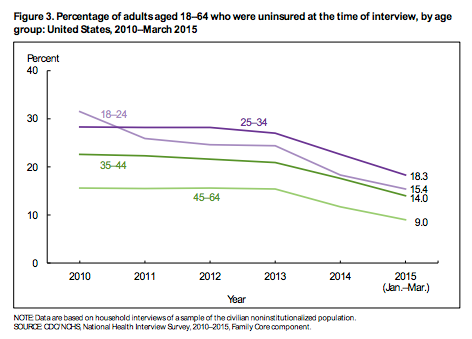
The largest declines were seen among adults who were poor or near-poor, suggesting that the Affordable Care Act was responsible for the most significant gains in coverage. Both groups dropped from uninsured rates near 50 percent in 2010 to 28 percent among poor adults and 23.8 percent among near-poor adults in 2015.
While Democrats are citing data as evidence that the Affordable Care Act is working, Republicans will likely argue that the reduction is being driven by an improving economy and a steadily declining unemployment rate.
Arkansas and Kentucky continue to record the most noticeable reductions in uninsured rates since Obamacare took effect at the beginning of 2013, according to a new report by Gallup. Texas is the only state to still have an uninsured rate higher than 20 percent.
We Built a $335 Million Power Plant in Afghanistan that Can Barely Turn on Lightbulb

USAID is denying that a $335 million “vital component” of their mission to aid the massive energy deficit in Kabul, Afghanistan is an utter failure, but a new report contradicts that claim.
A power plant built by U.S. Agency for International Development (USAID) is extremely underused and in danger of being wasted, according to the Special Inspector General for Afghanistan Reconstruction (SIGAR). USAID attempted to defend itself by saying the plant was only built to provide occasional backup and insurance for Kabul’s electrical grid, not for electrical power on a continuous basis. SIGAR’s report provides evidence that the plant was built for regular usage.
Related: U.S. Military Builds a $15 Million Warehouse That Nobody Wants
First, the basis of design was for a base load plant, built to operate 24 hours per day, 7 days a week. Also, the plant hasn’t made any impact on reducing Kabul’s massive energy deficit that USAID says is one of the plant’s main priorities. Not only is it not being used regularly, but it’s not even contributing additional electricity to increase the overall power supply in Kabul.
The Tarakhil Power Plant was built in July 2007 on the outskirts of Kabul, with the intention of supplying 18 diesel engines worth of operating power. Since Da Afghanistan Breshna Sherkat (DABS) – Afghanistan’s national power utility – assumed responsibility for the operation and maintenance of the facility in 2010, the plant has only performed at a shred of its total capability. Between July 2010 and December 2013, the USAID IG found that the plant performed at a mere 2.2 percent of its potential.
Since the Tarakhil Power Plant was used incorrectly and only on an intermittent basis, the plant has suffered premature wear and tear on its engine and electrical components. The damage is expected to raise already steep operation and maintenance costs.
Top Reads from the Fiscal Times:
- How ‘King Coal’ Could Swing the 2016 Election
- Kerry to Congress: Sign the Iran Deal or the Dollar Gets Hit
- China’s Currency Devaluation Brings Stocks to a 'Death Cross'
We Built a $335 Million Power Plant in Afghanistan that Can Barely Turn on Lightbulb
USAID is denying that a $335 million “vital component” of their mission to aid the massive energy deficit in Kabul, Afghanistan is an utter failure, but a new report contradicts that claim.
A power plant built by U.S. Agency for International Development (USAID) is extremely underused and in danger of being wasted, according to the Special Inspector General for Afghanistan Reconstruction (SIGAR). USAID attempted to defend itself by saying the plant was only built to provide occasional backup and insurance for Kabul’s electrical grid, not for electrical power on a continuous basis. SIGAR’s report provides evidence that the plant was built for regular usage.
Related: U.S. Military Builds a $15 Million Warehouse That Nobody Wants
First, the basis of design was for a base load plant, built to operate 24 hours per day, 7 days a week. Also, the plant hasn’t made any impact on reducing Kabul’s massive energy deficit that USAID says is one of the plant’s main priorities. Not only is it not being used regularly, but it’s not even contributing additional electricity to increase the overall power supply in Kabul.
The Tarakhil Power Plant was built in July 2007 on the outskirts of Kabul, with the intention of supplying 18 diesel engines worth of operating power. Since Da Afghanistan Breshna Sherkat (DABS) – Afghanistan’s national power utility – assumed responsibility for the operation and maintenance of the facility in 2010, the plant has only performed at a shred of its total capability. Between July 2010 and December 2013, the USAID IG found that the plant performed at a mere 2.2 percent of its potential.
Since the Tarakhil Power Plant was used incorrectly and only on an intermittent basis, the plant has suffered premature wear and tear on its engine and electrical components. The damage is expected to raise already steep operation and maintenance costs.