The Fiscal Times Newsletter - August 28, 2017
|
How CNN Is Cashing In on Trump-Mania

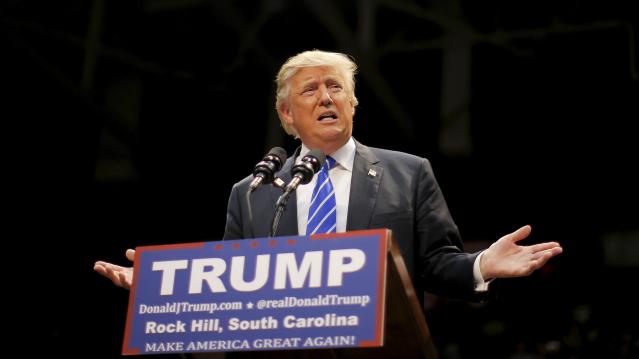
Fox News’s GOP debate last month generated blockbuster ratings — 24 million viewers saw Donald Trump and the other top Republican presidential contenders mix it up, making it the most-watched non-sports cable show ever. Now Fox News rival CNN is poised to cash in on that success.
The news network is asking advertisers to pay 40 times its usual rate, or as much as $200,000 for a 30-second commercial, during the second GOP debate, which it is scheduled to host on Sept. 16, according to Ad Age. CNN is also charging $50,000 to $60,000 for commercials airing that day in the earlier debate between second-tier candidates.
Related: Two New Polls Show Exactly Why Donald Trump Is Winning
Ad Age says CNN isn’t expected to pull in quite the same level of viewership as Fox News did, but even if the next primetime debate fails to match the earlier numbers, it is still likely to be the most-watched debate CNN has ever aired. The network can thank Trump for that, just as it could thank another outspoken and unpredictable GOP phenomenon for helping to set its previous debate record: In 2008, almost 11 million viewers tuned in to the vice presidential debate between Joe Biden and — you betcha! — Sarah Palin.
If the Palin example holds, news networks aren’t going to be the only ones to benefit from the Trump surge. “Saturday Night Live” saw its viewership and buzz soar in 2008 as Tina Fey’s impersonation of Palin became a sensation in its own right. And when the former Alaska governor appeared on SNL in October 2008, the show drew its highest ratings in 14 years.
Related: Trump Is Still Surging — Here’s Who Can Stop Him
The new season of SNL starts Oct. 3, so it’s probably a safe bet that Lorne Michaels — and other executives at NBC, even after the network dumped Trump from The Celebrity Apprentice in the wake of his comments about Mexican immigrants — are rooting for Trump mania to keep going for another month, at least. In the meantime, NBC announced Tuesday that Trump will appear on “The Tonight Show” next week.
Top Reads from The Fiscal Times:
- Doctors to Trump: Deporting Illegal Immigrants Would Be Bad for U.S. Health
- How Much Does Our Social Safety Net Cost? $742 Billion a Year and Rising
- If Clinton Loses Her Security Clearance, Could She Still Be President?
Automakers Are Having a Record Year, but Here’s a Trend that Should Worry Them

U.S. auto sales closed out the summer on a positive note, topping estimates and casting some rosy light on the health of the American consumer. Recording its best August since 2003, the auto industry is on pace to sell 17.8 vehicles in 2015, well ahead of expectations of 17.3 million. If the numbers hold up, 2015 will be the best year ever for U.S. auto sales, beating the 17.4 million mark set in 2000.
The general consensus is that auto industry is in pretty good shape these days. Gas prices and interest rates are low, boosting the market for cars and light trucks. More than 2 million jobs were added to the U.S. economy in the past year, and more jobs is usually good news for auto sales. The unemployment rate has been trending lower for five years, sitting at a relatively healthy 5.3 percent in July.
Related: What's Next for Oil Prices? Look Out Below!
As with any statistic, though, there’s more than one way to look at the situation. Sure, auto sales are climbing as the economy gets stronger and more Americans hit their local car dealers’ lots. At least to some degree, though, higher auto sales should be expected just as a result of U.S. population growth. And those rising monthly sales figures are masking a continuing trend that is more worrisome for the auto industry: per capita auto sales are still in a long-term decline, even including the solid growth the industry has seen since the end of the recession. Doug Short at Advisor Perspectives did the math and made a graph:

According to Short’s analysis, the peak year for per capita auto sales in the U.S. was 1978. As the red line in the graph shows, the trend is negative since then.
In the graph, per capita auto sales in January, 1976, were defined as 100; the readings in the index since then are relative to that 1976 sales level. As you can see, the index moves higher until August of 1978, when per capita auto sales were up nearly 20 percent over 1976. Since then, per capita auto sales have fallen, reaching a low in 2009 that was nearly 50 percent lower than 1976. Since 2009, per capita auto sales have risen nicely, but are still more than 15 percent below peak.
What could explain the negative trend? Two factors come to mind. First, demographics. It has been widely reported that the millennial generation is less interested in owning cars for a variety of reasons, ranging from a weak economy to a cultural shift away from suburban life. However, the data on millennial car purchases is ambiguous; recently, millennials have started buying cars in volumes that look a lot like their elders. And even if millennials are less interested in buying cars, their preferences can’t explain a shift that began in the 1970s, before they were born.
Related: U.S. Companies Are Dying Faster Than Ever
The other factor that may explain the trend is income inequality. A study of car ownership by the Carnegie Foundation found that countries with higher income inequality have fewer cars per capita. The logic is simple: As more income is claimed by the wealthy, there’s less to go around for everyone else. And that means there’s less money for middle and lower income groups to buy and maintain automobiles, among other things.
Here’s a chart of the Gini index for the U.S. since 1947. (The Gini Index is a widely-used measure of income inequality. A higher Gini number means higher inequality.) Note that the Gini reading started climbing in the late ‘70s – the same time when per capita car ownership in the U.S. began to fall.
This chart tells us, not for the first time, that the U.S. has experienced more income inequality since the 1970s. Combined with the per capita auto sales data above, it suggests that as the rich have gotten richer and everyone else has struggled to keep up, car ownership has suffered. Although this is by no means proof of the relationship between income inequality and per capita car ownership over the last 40 years, it hints at an interesting theory – and suggests that the auto industry has good reason to be concerned about growing inequality in the U.S.

Top Reads From The Fiscal Times:
- 6 Reasons Gas Prices Could Fall Below $2 a Gallon
- Hoping for a Raise? Here’s How Much Most People Are Getting
- What the U.S. Must Do to Avoid Another Financial Crisis
Doctors to Trump: Deporting Illegal Immigrants Would Be Bad for U.S. Health

The American College of Physicians has a message for Donald Trump and any other presidential contender advocating for mass deportation of illegal immigrants: Any plan to kick out those 12 million people from the country could have severe public health consequences.
On Tuesday, the doctors’ group, which represents 143,000 internists, released a statement urging physicians to take a stand against proposals for mass deportation.
Related: Vast Majority of Americans Say Illegal Immigrants Should Stay
“Large-scale deportation of undocumented residents would have severe and unacceptable adverse health consequences for many millions of vulnerable people,” Dr. Wayne J. Riley, the groups’ president, said in a statement. “Numerous studies show that deportation itself, as well as the fear of being deported, causes emotional distress, depression, trauma associated with imposed family separations, and distrust of anyone assumed to be associated with federal, state and local government, including physicians and other health care professionals providing care in publicly-funded hospitals and clinics.”
That distrust, in turn, could result in sick people not getting medical attention, and in cases of patients with infectious diseases, it could even lead to a public health emergency with tremendous costs to the to the overall health care system, the group warned.
On the other hand, having illegal immigrants in the country carries health care costs, too. Medicaid pays around $2 billion a year for emergency treatment for illegal immigrants, Kaiser Health News reported in 2013, adding that the total represents less than 1 percent of total Medicaid costs.
Related: Birthright Citizenship, the New Immigration Scam
Still, the American College of Physicians said doctors have an ethical obligation to advocate for the health interests of all people, without consideration of their residency status.
“Physicians and other health professionals must remind politicians and policymakers that deporting millions of vulnerable people would have adverse health care consequences, not only for the people directly affected and their families, but also for their local communities and for the United States as whole,” Riley said in the statement. “Instead, we need a balanced immigration policy that ensures access to healthcare for all U.S. residents while recognizing that we need appropriate controls over who is admitted.”
Top Reads From The Fiscal Times
- The 10 States with the Worst Roads
- 5 Reasons the Trump Immigration Plan Doesn’t Pass the Reality Test
- Scott Walker Adjusts His Immigration Stance. Again.
Google’s New Logo Is a Sign of Where the Company Is Headed

Google is shaking things up again, rolling out a new logo that indicates where the company is going even as it keeps the colored letters that have become so familiar. The company’s most significant redesign since 1999 does away with the old font and its serifs (those little lines at the end of each character) and replaces them with the same custom typeface used in the logo for Google’s new parent company, Alphabet.
The new look does more than just make the logo sleeker and more modern while echoing the newly created holding company. It also speaks to where Google is going — namely, its increasing presence on our mobile devices. Google’s Vice President of Product Management Tamar Yehoshua and Director of User Experience Bobby Nath explained the transition on the company’s blog:
“Once upon a time, Google was one destination that you reached from one device: a desktop PC. These days, people interact with Google products across many different platforms, apps and devices—sometimes all in a single day. You expect Google to help you whenever and wherever you need it, whether it’s on your mobile phone, TV, watch, the dashboard in your car, and yes, even a desktop!”
Related: 10 Biggest Tech Flops of the Century
Google said in May that the number of searches on mobile devices had surpassed those on computers in 10 countries, including the U.S. and Japan. Its simplified new logo will load faster and read better “even on the tiniest screens.” And when six letters are still too much to fit on one of those tiny screens, the company will present a four-color “G” icon that matches its new logo, or four animated dots that morph into other forms; the swirling new feature is meant to “represent Google’s intelligence at work and indicate when Google is working for you,” according to a post on Google’s Design blog.
In other words, they’re a tiny bit of swirling fun that will placate you as you wait for your information to load — and remind you that you’re using a Google service and not some other company’s product. Together, the new logo, the new “G” icon and the colored dots are Google’s way to keep stamping its brand on our increasingly mobile world.
Top Reads from The Fiscal Times
- Why McDonald’s could Suddenly Be Responsible for Millions of New Employees
- The 10 Worst States for Property Taxes
- U.S. Companies Are Dying Faster than Ever
The Top 10 Cities Where Small-Biz Jobs Are Growing

Small businesses have been hiring, though at a slower rate than this time last year, according to the Paychex|IHS job index.
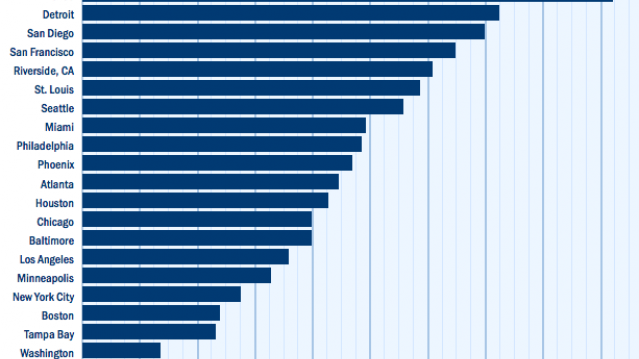
For the 11th month in a row, Dallas’s small businesses have shown the most employment gains. The city boasts the top 12-month growth rate at 1.38 percent. Detroit (1.35 percent), San Diego (1.27 percent), Baltimore and St. Louis (both 1.13 percent) round out the top five. Houston’s recent performance is also impressive, with a rebound in growth rates over the past three months compared with declines during the rest of the year.
Related: This Is the Best Time Since the Recession to Get a Small Business Loan
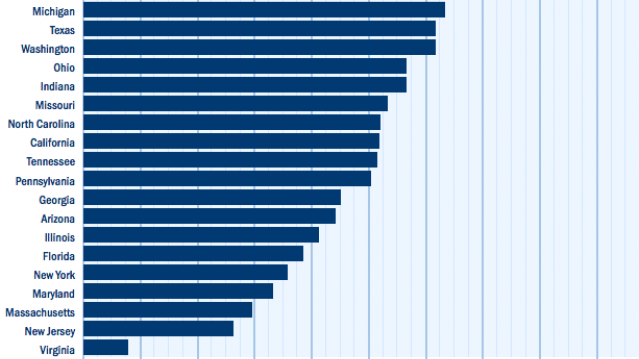
Only five states saw positive gains in employment rates over the past year, and none of them increased by a full statistical point. One notable state is Michigan, which ranks second behind Wisconsin, as the state with the highest employment gains in small businesses since 2004. It also came in second for highest gains in the past year.
The index numbers used by Paychex for cities and states is based on the current small business employment rate as compared with 2004. Paychex uses 2004 as the base period to compare current gains against because it was a year of expansion for small businesses. Below 100, and the rate is lower than in 2004. Above 100, and the rate is higher than in 2004.
The charts below rank the cities and states based on their index levels.
Top Reads from The Fiscal Times
- Why McDonald’s could Suddenly Be Responsible for Millions of New Employees
- The 10 Worst States for Property Taxes
- U.S. Companies Are Dying Faster than Ever


